


Executive Summary
Scientists’ use of flawed statistics and editors’ complaisant practices both contribute to the mass production and publication of irreproducible research in a wide range of scientific disciplines. Far too many researchers use unsound scientific practices. This crisis poses serious questions for policymakers. How many federal regulations reflect irreproducible, flawed, and unsound research? How many grant dollars have funded irreproducible research? How widespread are research integrity violations? Most importantly, how many government regulations based on irreproducible science harm the common good?
The National Association of Scholars’ (NAS) project Shifting Sands: Unsound Science and Unsafe Regulation examines how irreproducible science negatively affects select areas of government policy and regulation governed by different federal agencies. We also seek to demonstrate procedures which can detect irreproducible research. This second policy paper in the Shifting Sands project focuses on irreproducible research in the field of nutritional epidemiology, which informs much of the U.S. Food and Drug Administration’s (FDA) nutrition policy.
The scientific (academic) world’s professional incentives reward exciting research with new positive (statistically significant) claims—but not reproducible research. This encourages researchers, wittingly or negligently, to use different flawed statistical practices to produce positive, but likely false, claims. Our report applies Multiple Testing and Multiple Modeling (MTMM) to assess whether a body of research indeed has been affected by such flawed practices.
MTMM controls for experiment-wise error—the probability that at least one individual claim will register a false positive when multiple statistical tests are conducted. Conducting large numbers of statistical tests in a study produces many false positives by chance alone. We counted the number of statistical tests and used a novel statistical technique—p-value plotting—as a severe test to diagnose specific claims made about relationships between i) consumption of red and processed meats and health outcomes such as mortality, cancers, and diabetes; and ii) soy protein and lipid (cholesterol) markers as surrogates for cardiovascular disease risk reduction.
We found persuasive circumstantial evidence that the scientific literature (in general) and statistical practices (specifically) affecting the nutritional epidemiology of red and processed meats and negative health outcomes, and soy protein and cardiovascular disease risk reduction, are untrustworthy. All of these flawed statistical practices center around the use of the semi-quantitative Food Frequency Questionnaire (FFQ) – a self-administered dietary assessment instrument. FDA nutritional policies on red and processed meats and soy protein might have been very different had they applied more rigorous scientific reproducibility requirements to research that they used to justify their policies.
We offer 12 recommendations that are intended to bring FDA methodologies up to the level of best available science, as per the mandate of The Information Quality Act (sometimes called The Data Quality Act):
- Adopt resampling methods (Multiple Testing and Multiple Modeling) as part of the standard battery of tests applied to nutritional epidemiology research.
- Take greater account of difficulties associated with subgroup analysis in nutritional research – which increases the possibility of producing false positive relationships.
- Require all studies that do not correct for MTMM to be labeled “exploratory.”
- Rely exclusively on meta-analyses that use tests to take account of endemic HARKing, p-hacking, and other questionable research procedures.
- For all research that informs FDA approval of nutritional health claims:
- require the FDA in its assessments of scientific studies to take account of endemic HARKing, p-hacking and other questionable research procedures, e.g. require p-value plot analysis for all FFQ meta-analysis studies used to inform regulations;
- require preregistration and registered reports for observational studies as well as for randomized clinical trials;
- require public access to all relevant data sets;
- place greater weight on reproducible research;
- consider more far-reaching reforms, such as funding data set building and data set analysis separately; and
- take account of the irreproducibility crisis in the use of the “weight of evidence” standard to assess both base studies and meta-analyses.
- Do not fund or rely on research of other organizations such as the World Health Organization (WHO) until these organizations adopt sound statistical practices.
- Establish systematic procedures to inhibit research integrity violations.
We have subjected the science underpinning nutritional health claims in relation to red and processed meat and soy protein to serious scrutiny. We believe the FDA should take account of our methods as it considers food health claims. Yet we care even more about reforming the procedures the FDA uses in general to assess nutritional science.
The government should use the very best science—whatever the regulatory consequences. Scientists should use the very best research procedures—whatever result they find. Those principles are the twin keynotes of this report. The very best science and research procedures involve building evidence on the solid rock of transparent, reproducible, and actual reproduced scientific inquiry, not on shifting sands.
Preface and Acknowledgments
Peter W. Wood
President,
National Association of Scholars
An irreproducibility crisis afflicts a wide range of scientific and social-scientific disciplines, from epidemiology to social psychology. Improper research techniques, a lack of accountability, disciplinary and political groupthink, and a scientific culture biased toward producing positive results contribute to this plight. Other factors include inadequate or compromised peer review, secrecy, conflicts of interest, ideological commitments, and outright dishonesty.
Science has always had a layer of untrustworthy results published in respectable places and “experts” who were eventually shown to have been sloppy, mistaken, or untruthful in their reported findings. Irreproducibility itself is nothing new. Science advances, in part, by learning how to discard false hypotheses, which sometimes means dismissing reported data that does not stand the test of independent reproduction.
But the irreproducibility crisis is something new. The magnitude of false (or simply irreproducible) results reported as authoritative in journals of record appears to have dramatically increased. “Appears” is a word of caution, since we do not know with any precision how much unreliable reporting occurred in the sciences in previous eras. Today, given the vast scale of modern science, even if the percentage of unreliable reports has remained fairly constant over the decades, the sheer number of irreproducible studies has grown vastly. Moreover, the contemporary practice of science, which depends on a regular flow of large governmental expenditures, means that the public is, in effect, buying a product rife with defects. On top of this, the regulatory state frequently builds both its cases for regulation and the substance of its regulations on the basis of unproven, unreliable, and sometimes false scientific claims.
In short, many supposedly scientific results cannot be reproduced reliably in subsequent investigations and offer no trustworthy insight into the way the world works. A majority of modern research findings in many disciplines may well be wrong.
That was how the National Association of Scholars summarized matters in our report The Irreproducibility Crisis of Modern Science: Causes, Consequences, and the Road to Reform (2018).1 Since then we have continued our work to press for reproducibility reform by several different avenues. In February 2020, we co-sponsored with the Independent Institute an interdisciplinary conference on Fixing Science: Practical Solutions for the Irreproducibility Crisis, to publicize the irreproducibility crisis, exchange information across disciplinary lines, and canvass (as the title of the conference suggests) practical solutions for the irreproducibility crisis.2 We have also provided a series of public comments in support of the Environmental Protection Agency’s rule Strengthening Transparency in Pivotal Science Underlying Significant Regulatory Actions and Influential Scientific Information.3 We have publicized different aspects of the irreproducibility crisis by way of podcasts and short articles.4
And we have begun work on our Shifting Sands project. In May 2021 we published Shifting Sands: Report I Keeping Count of Government Science: P-Value Plotting, P-Hacking, and PM2.5 Regulation.5 This report, Flimsy Food Findings: Food Frequency Questionnaires, False Positives, and Fallacious Procedures in Nutritional Epidemiology, is the second of four that will appear as part of Shifting Sands, each of which will address the role of the irreproducibility crisis in different areas of federal regulatory policy. In these reports we address a central question that arose after we published The Irreproducibility Crisis.
You’ve shown that a great deal of science hasn’t been reproduced properly and may well be irreproducible. How much government regulation is actually built on irreproducible science? What has been the actual effect on government policy of irreproducible science? How much money has been wasted to comply with regulations that were founded on science that turned out to be junk?
This is the $64 trillion dollar question. It is not easy to answer. Because the irreproducibility crisis has so many components, each of which could affect the research that is used to inform regulatory policy, we are faced with a maze of possible sources of misdirection.
The authors of Shifting Sands include these just to begin with:
- malleable research plans;
- legally inaccessible data sets;
- opaque methodology and algorithms;
- undocumented data cleansing;
- inadequate or non-existent data archiving;
- flawed statistical methods, including p-hacking;
- publication bias that hides negative results; and
- political or disciplinary groupthink.
Each of these could have far-reaching effects on government regulatory policy—and for each of these, the critique, if well-argued, would most likely prove that a given piece of research had not been reproduced properly—not that it actually had failed to reproduce. (Studies can be made to “reproduce,” even if they don’t really.) To answer the question thoroughly, one would need to reproduce, multiple times, to modern reproducibility standards, every piece of research that informs governmental regulatory policy.
This should be done. But it is not within our means to do so.
What the authors of Shifting Sands did instead was to reframe the question more narrowly. Governmental regulation is meant to clear a high barrier of proof. Regulations should be based on a very large body of scientific research, the combined evidence of which provides sufficient certainty to justify reducing Americans’ liberty with a government regulation. What is at issue is not any particular piece of scientific research, but rather whether the entire body of research provides so great a degree of certainty as to justify regulation. If the government issues a regulation based on a body of research that has been affected by the irreproducibility crisis so as to create the false impression of collective certainty (or extremely high probability), then, yes, the irreproducibility crisis has affected government policy by providing a spurious level of certainty to a body of research that justifies a government regulation.
The justifiers of regulations based on flimsy or inadequate research often cite a version of what is known as the “precautionary principle.” This means that, rather than basing a regulation on science that has withstood rigorous tests of reproducibility, they base the regulation on the possibility that a scientific claim is accurate. They do this with the logic that it is too dangerous to wait for the actual validation of a hypothesis, and that a lower standard of reliability is necessary when dealing with matters that might involve severely adverse outcomes if no action is taken.
This report does not deal with the precautionary principle, since it summons a conclusiveness that lies beyond the realm of actual science. We note, however, that invocation of the precautionary principle is not only non-scientific, but is also an inducement to accepting meretricious scientific practice and even fraud.
The authors of Shifting Sands addressed the more narrowly framed question posed above. They applied a straightforward statistical test, Multiple Testing and Multiple Modeling (MTMM), and applied it to a body of meta-analyses used to justify government research. MTMM provides a simple way to assess whether any body of research has been affected by publication bias, p-hacking, and/or HARKing (Hypothesizing After the Results were Known)—central components of the irreproducibility crisis. In this second report, the authors applied this MTMM method to portions of the research underlying the Food and Drug Agency’s (FDA) labeling requirements for health claims that characterize the relationship between a substance (e.g., a food or food component) and a health benefit, a disease (e.g., cancer or cardiovascular disease), or a health condition (e.g., high blood pressure). The scientific literature (in general) and statistical practices (specifically) of nutritional epidemiology of red and processed meats and negative health outcomes and soy protein and cardiovascular disease risk reduction are untrustworthy. All of these flawed statistical practices center around the use of the semi-quantitative Food Frequency Questionnaire (FFQ) – a self-administered dietary assessment instrument. U.S. FDA nutrition policies on red and processed meats and soy protein might have been very different had they applied more rigorous scientific reproducibility requirements to research that they used to justify their policies.
That’s the headline conclusion. But it leads to further questions. Why didn’t the FDA use this statistical technique long ago? How exactly does regulatory policy assess scientific research? What precise policy reforms does this research conclusion therefore suggest?
The broadest answer to why the FDA hasn’t adopted this statistical technique for assessing health claims is that the entire discipline of nutritional epidemiology depends upon a series of assumptions and procedures, many of which give pause to professionals in different fields—and which should give pause to the layman as well.
- Nutritional epidemiology relies predominantly on observational data and associations, which researchers generally judge to be less reliable than experimental data and interventions. FDA Guidance Documents acknowledge the shortcomings of food consumption surveys, including FFQs, and usually note that observational studies are less reliable than intervention studies—but still allow FFQs to inform FDA regulation.
- Nutritional epidemiology particularly relies on Food Frequency Questionnaires (FFQs), which have become the most common method by which scientists measure dietary intake in large observational study populations. Scholars have noted for decades that an FFQ is an unreliable source of data, since it relies on subjects’ ability both to remember accurately what they have consumed and to report with equal accuracy. FFQ association studies also frequently gloss over the complexities of digestion. Individuals consume thousands of chemicals in millions of possible daily combinations and it therefore is challenging, if not impossible, to disentangle the association of a single dietary (food) component with a single disease.
- FFQs possess data for dozens or hundreds of substances and health outcomes, and therefore are extremely susceptible to multiple testing and the manufacture of false positive results. FFQs, unless corrected for Multiple Testing and Multiple Modeling (MTMM), are virtually guaranteed to produce a spurious correlation between some food and some disease. Researchers can use multiple testing and multiple modelling until they find an exciting result to submit to the editors and referees of a professional journal.
- At the most fundamental statistical level, nutritional epidemiology has not taken into account the recent challenges posed to the very concept of statistical significance, or the procedures of probability of causation.6 The Shifting Sands authors confined their critique to much narrower grounds, but readers should be aware that the statistical foundations underlying nutritional epidemiology are by no means secure.
- Most relevantly for Shifting Sands, nutritional epidemiology as a discipline has rejected the need to adjust results for multiple comparisons. The entire discipline of nutritional epidemiology uses procedures that are guaranteed to produce false positives and rejects using well-established corrective procedures. MTMM tests have been available for decades. Genetic epidemiologists adopted them long ago. Nutritional epidemiology rejects MTMM tests as a discipline—and because it does, the FDA can say it is simply following professional judgment.
These are serious flaws—and I don’t mean by highlighting them to suggest that nutritional epidemiologists haven’t done serious and successful work to keep themselves on the statistical straight-and-narrow. The discipline does a great deal correctly, for which it should be commended. But the discipline isn’t perfect. It possesses blind-spots that amount to disciplinary groupthink. Americans must not simply defer to nutritional epidemiology’s “professional consensus.”
Yet that is what the FDA does—and, indeed, the federal government as a whole. The intention here was sensible—that government should seek to base its views on disinterested experts as the best way to provide authoritative information on which it should act. Yet there are several deep-rooted flaws in this system, which have become increasingly apparent in the decades since the government first developed an extensive scientific-regulatory complex.
- Government regulations do not account for disciplinary group-think.
- Government regulations do not account for the possibility that a group of scientists and governmental regulators, working unconsciously or consciously, might act to skew the consideration of which scientific studies should be used to inform regulation.
- Government regulations define “best available science” by the “weight of evidence” standard. This is an arbitrary standard, subject to conscious or unconscious manipulation by government regulators. It facilitates the effects of groupthink and the skewed consideration of evidence.
- Governmental regulations have failed to address fully the challenge of the irreproducibility crisis, which requires a much higher standard of transparency and rigor than was previously considered “best acceptable science.”
- The entire framework of seeking out disinterested expertise fails to take into account the inevitable effects of using scientific research to justify regulations that affect policy, have real-world effect, and become the subject of political debate and action. The political consequences have unavoidably had the effect of tempting political activists to skew both scientific research and the governmental means of weighing scientific research. Put another way, any formal system of assessment inevitably invites attempts to game it.
- To all this we may add the distorting effects of massive government funding of scientific research. The United States federal government is the largest single funder of scientific research in the world; its expectations affect not only the research it directly funds but also all research done in hopes of receiving federal funding. Government experts therefore have it in their power to create a skewed body of research, which they can then use to justify regulation.
Shifting Sands casts a critical eye on the procedures of the field of nutritional epidemiology, but it also casts a critical eye on governmental regulatory procedure, which has provided no check to the flaws of the nutritional epidemiology discipline, and which is susceptible to great abuse. Shifting Sands is doing work that nutritional epidemiologists and governmental regulators should have done decades ago. Their failure to do so is in itself substantial evidence of the need for widespread reform, both among nutritional epidemiologists and among governmental regulators.
Before I go further, I should make clear the stakes of the “skew” in science that feeds regulation.
A vast amount of government regulation is based on scientific research affected by the irreproducibility crisis. This research includes such salient topics as racial disparity, implicit bias, climate change, and pollution regulation—and every aspect of science and social science that uses statistics. Climate change is the most fiercely debated subject, but the EPA’s pollution regulations are a close second—not least because American businesses must pay extraordinary amounts of money to comply with them. A 2020 report prepared for the Natural Resource Defense Council estimates that American air pollution regulations cost $120 billion per year—and we may take the estimate provided to an environmental advocacy group to be the lowest plausible number.7 The economic consequences carry with them correspondingly weighty political corollaries: the EPA’s pollution regulations constitute a large proportion of the total power available to the federal government. The economic and political consequences of the EPA’s regulations are why we devoted our first Shifting Sands report to PM2.5 regulation.
The consequences of FDA regulation are at least as consequential, for they affect the food and drink consumed by every American. So therefore are the consequences of FDA mis-regulation. Inaccurate labels can mislead consumers, not least by encouraging them to adopt fad diets that present health risks. Furthermore, every company in the food sector, which involved $6.22 trillion dollars in annual sales in 2020, depends for its livelihood on accurate labeling of food products. Mislabeling health benefits can give a company a larger market share than it deserves.
To take a more concrete example, the Code of Federal Regulations declares that “The scientific evidence establishes that diets high in saturated fat and cholesterol are associated with increased levels of blood total- and LDL-cholesterol and, thus, with increased risk of coronary heart disease,” and allows companies to make corollary health claims about reducing the risk of heart disease.8 The FDA duly notes on its Interactive Nutrition Facts Label that “Diets higher in saturated fat are associated with an increased risk of developing cardiovascular disease.”9 Yet recent research concludes that “Numerous meta-analyses and systematic reviews of both the historical and current literature reveals that the saturated-fat diet-heart hypothesis was not, and still is not, supported by the evidence. There appears to be no consistent benefit to all-cause or CVD mortality from the reduction of dietary saturated fat.”10 The law rather than the FDA’s approach to statistics was at issue here, but the financial consequences have been enormous: consumers have redirected billions of dollars toward producers of foods with less saturated fats, for a diet that has no discernible health benefit.
Shifting Sands strengthens the case for policy reforms that would strengthen the FDA’s procedures to assess nutritional epidemiology research results. The authors and I believe that this is the logical corollary of the current state of statistically informed science. I trust that we would favor the rigorous use of MTMM tests no matter what policy result they indicated, and I will endeavor to make good on that principle if MTMM tests emerge that argue against my preferred policies. Those are the policy stakes of Shifting Sands. I hope that its scientific claims will be judged without reference to its likely policy consequences. The possible policy consequences have not pre-determined the report’s findings. We claim those findings are true, regardless of the consequences, and we invite others to reproduce our work.
This report puts into layman’s language the results of several technical studies by members of the Shifting Studies team of researchers, S. Stanley Young and Warren Kindzierski. Some of these studies have been accepted by peer-reviewed journals; others have been submitted and are under review. As part of NAS’s own institutional commitment to reproducibility, Young and Kindzierski pre-registered the methods of their technical studies. And, of course, NAS’s support for these researchers explicitly guaranteed their scholarly autonomy and the expectation that these scholars would publish freely, according to the demands of data, scientific rigor, and conscience.
This report is the second of four scheduled reports, each critiquing different aspects of the scientific foundations of federal regulatory policy. We intend to publish these reports separately and then as one long report, which will eliminate some necessary duplication in the material of each individual report. The NAS intends these four reports collectively to provide a substantive, wide-ranging answer to the question What has been the actual effect on government policy of irreproducible science?
I am deeply grateful for the support of many individuals who made Shifting Sands possible. The Arthur N. Rupe Foundation provided Shifting Sands’ funding—and, within the Rupe Foundation, Mark Henrie’s support and goodwill got this project off the ground and kept it flying. Three readers invested considerable time and thought to improve this report with their comments: David C. Bryant, Douglas Hawkins, and Richard Williams. David Randall, NAS’s Director of Research, provided staff coordination of Shifting Sands—and, of course, Stanley Young has served as Director of the Shifting Sands Project. Reports such as these rely on a multitude of individual, extraordinary talents.
Introduction
How Food Regulations Get Made
The Food and Drug Administration (FDA) now requires that foods (except for meat from livestock, poultry and some egg products, which are regulated by the U.S. Department of Agriculture) be safe, wholesome, sanitary, and properly labeled.11 The FDA’s labeling requirements include mention of health claims that characterize the relationship between a substance (e.g., a food or food component) and a health benefit, a disease (e.g., cancer or cardiovascular disease), or a health condition (e.g., high blood pressure).
The discipline of nutritional epidemiology plays a vital role in the FDA’s labeling requirements. The FDA uses nutritional epidemiology to provide compelling scientific information to support its nutrition recommendations and more coercive regulations.12 Nutritional epidemiology applies epidemiological methods to the study at the population level of the effect of diet on health and disease in humans. Nutritional epidemiologists base most of their inferences about the role of diet (i.e., foods and nutrients) in causing or preventing chronic diseases on observational studies.
From the 1980s onward, the increase of computing capabilities facilitated the application of essentially retrospective self-administered dietary assessment instruments the semi-quantitative food frequency questionnaire (FFQ).13 FFQs, which are easy to use, place low burdens on participants, and allegedly capture long-term dietary intake, have become the most common method by which scientists measure dietary intake in large observational study populations.14
A longstanding criticism of using nutritional epidemiology to determine causality is that it relies predominantly on observational data and associations, which are generally judged to be less reliable than experimental data and interventions.15 FDA Guidance Documents acknowledge the shortcomings of food consumption surveys, including FFQs, and usually note that observational studies are less reliable than intervention studies—but still allow FFQs to inform FDA regulation.16
The FDA does not take sufficient account of nutritional epidemiology’s frail foundations.
Nutritional Epidemiology’s Frail Foundations
Food Frequency Questionnaires
You are what you eat, the proverb goes. Certainly, some illnesses can proceed from diet, such as anemia.17 Most Americans have health problems at some point in their lives and they conclude frequently that poor diet has caused their poor health. They think so more than ever because of the invention and the spread of the Food Frequency Questionnaire (FFQ).
Walter Willett is Scientist Zero of the FFQ. He devised and publicized the FFQ in his “Reproducibility and validity of a semi-quantitative food frequency questionnaire” (1985); as of 2021 that article had been cited more than 4,000 times.18 A FFQ distributes a structured food list and a frequency response section to study participants, who indicate from memory their usual frequency of intake of each food and beverage over a set period of time, usually a day or a week.19 After some lapse of time, typically years, the subjects self-report on their health conditions. Willett, and all his followers, thus have data by which to propose an association between a particular food or diet and a particular health condition.
Scientists conduct statistical comparisons to establish the association between FFQ dietary data items and health outcomes to produce multiple research papers. They then conduct further statistical analyses using meta-analyses of the individual research papers, which combine data from multiple published studies that address a common research question, such as the association between a particular food and a particular disease.20 For example, one meta-analysis combines data of all published studies that examine the claim that high salt intake is associated with gastric cancer.21
Scholars have noted for decades that an FFQ is an unreliable source of data, since it relies on subjects’ ability both to remember accurately what they have consumed and to report with equal accuracy.22
Scholars have noted for decades that an FFQ is an unreliable source of data, since it relies on subjects’ ability both to remember accurately what they have consumed and to report with equal accuracy.
FFQ association studies also frequently gloss over the complexities of digestion. Individuals consume thousands of chemicals in millions of possible daily combinations and it therefore is challenging, if not impossible, to disentangle the association of a single dietary (food) component with a single disease.23 To label a single food component a “cause” of disease in any case glosses over the fact that true biochemical interactions frequently involve actual causative agents (i.e., chemicals or microbes in food), the intermediary products of digestion, and human disease.24 A proper analysis needs to disentangle ultimate causes and proximate causative agents—a task for which FFQs are ill equipped.
Researchers are aware of the unreliability of FFQs, and are working diligently to find alternative research tools,25 yet many scientists continue to engage in a cottage industry of FFQ research. FFQ studies, after all, are relatively inexpensive to conduct and relatively sure to find a positive result. (We will explore below why FFQs find positive results so frequently.) Therefore, they are attractive to the great majority of researchers, who must both work on a budget and secure a steady stream of academic publications. FFQs' known flaws have not prevented them from flourishing wildly. (See Figure 1.)
Figure 1: FFQ Citations Since 198526
|
Years |
FFQ Citations |
|
1981-85 |
777 |
|
1986-90 |
980 |
|
1991-95 |
1,650 |
|
1996-2000 |
2,400 |
|
2001-05 |
4,450 |
|
2006-10 |
8,650 |
|
2011-15 |
14,900 |
|
2016-20 |
15,400 |
|
2021 |
4,640 |
|
Total |
53,847 |
Since 2001, scholars have published about 2,300 FFQ studies annually.27 A 2021 Google Scholar search using “FFQ” and “meta-analysis” returned 22,800 citations.28
And most cohort studies use FFQs.
Cohort Studies
Scientists have conducted cohort studies with increasing frequency since the 1950s. Cohort studies start with hundreds to thousands of people and follow them over an extended period of time—often many years.29 Researchers measure study participants’ initial attributes, including by means of an FFQ, and then collect health results over a succeeding period of time. Cohort studies often require substantial start-up costs, but it costs relatively little to examine more attributes of an already assembled group.
A cohort study can take on a life of its own. The Life Project in England, which examined children born within a small period of time, has become a generations-long cohort study about human development that has provided data for innumerable professional articles in a range of social science and health disciplines. Researchers have published 2,500 papers on the 1958 cohort alone.30
Cohort studies make it easy for scientists to publish multiple papers using the same data set. But to engage in multiple testing creates a serious and scarcely acknowledged statistical problem, which affects the entire field of cohort studies.
Cohort studies make it easy for scientists to publish multiple papers using the same data set.
Multiple Testing and the Manufacture of False Positive Results
Scientists who conduct cohort studies generally use a simple statistical analysis strategy on the data they collect—which causes or risk factors are associated with which outcomes (i.e., health conditions). This procedure allows researchers to analyze an extraordinarily large number of possible relationships.
If a data set contains “C” causes and “O” outcomes, then scientists can investigate C x O possible relationships. They can also examine how yes/no adjustment factors “A”, such as parental age, income, or education, can modify each of the C x O relationships.
We can approximate the number of possible questions that one can examine in a cohort study with the following formula:
(C) x (O) x (2 raised to the power of A) = CO2^A
The number of possible questions at issue can increase extraordinarily rapidly in a cohort study. Consider this hypothetical cohort study of the relationship between a food substance and a disease or health-related condition:
● The number of possible questions in a cohort study with survey data for 61 foods from an FFQ,31 10 possible outcomes (diseases) of interest, and 5 yes/no adjustment factors (e.g., age, sex, marital status, ethnicity, education level) can be approximated as (61) x (10) x (2^5) = 19,520.
● The number of possible questions in a cohort study with survey data for 61 foods from an FFQ, 20 possible outcomes (diseases) of interest, and 10 yes/no adjustment factors (e.g., age, sex, marital status, ethnicity, education level, body mass index, smoking status, total energy intake, physical activity level, sleep duration) can be approximated as (61) x (20) x (2^10) = 1,249,280.32
Researchers doing cohort studies who examine these C x O x 2^A possible models can correct their work to take account of Multiple Testing and Multiple Modeling (MTMM).33 (For a longer explanation of Multiple Testing Multiple Modeling, see Appendix 1.) If they do not, and mostly they don’t, they can produce large numbers of false positive results—and quickly, given the spread through the scientific community of cheap, fast computer hardware and statistical software.34
Given that the conventional threshold for statistical significance (and hence of professional publication) in most disciplines is a p-value of less than 0.05, a false positive result should occur 5% of the time by chance alone.35 (For a longer discussion of statistical significance, see Appendix 2.) In our first hypothetical example, we should expect 976 false positive results (5% of 19,520). In our second hypothetical example, we should expect 62,464 false results (5% of 1,249,280).
Scientists generally are at least theoretically aware of this danger, albeit nutritional epidemiologists have done far too little to correct their professional practices.36 Schoenfeld and Ioannidis put it pungently:
In this survey of published literature regarding the relation between food ingredients and malignancy, we found that 80% of ingredients from randomly selected recipes had been studied in relation to malignancy and the large majority of these studies were interpreted by their authors as offering evidence for increased or decreased risk of cancer. However, the vast majority of these claims were based on weak statistical evidence. Many statistically insignificant “negative” and weak results were relegated to the full text rather than to the study abstract. Individual studies reported larger effect sizes than did the meta-analyses. There was no standardized, consistent selection of exposure contrasts for the reported risks. A minority of associations had more than weak support in meta-analyses, and summary effects in meta-analyses were consistent with a null average and relatively limited variance.37
Scientists also have warned their peers about the particular dangers of multiple testing of cohort studies. Bolland and Grey commented in 2014 on research pertaining to the Nurses’ Health Study (NHS) that:
Investigators have published more than 1000 articles on the NHS, at a rate of more than 50 papers/year for the last 10 years. … To date, more than 2000 hypotheses have been tested in these papers, and it seems likely that the number of statistical tests carried out would be in the tens of thousands. … Given the volume of hypotheses assessed and statistical tests undertaken, it seems likely that many results reported in NHS publications are false positives, and that the use of a threshold of P=0.05 for statistical significance is inappropriate without consideration of multiple statistical testing.
We suggest that authors of observational studies should report how many hypotheses have been tested previously in their cohort study, together with an estimate of the total number of statistical tests undertaken.38
Methods to adjust for MTMM have existed for decades. The Bonferroni method simply adjusts the p-value by multiplying the p-value by the number of tests. Westfall and Young provide a simulation-based method for correcting an analysis for MTMM.39 In practice, however, far too much "research" simply ignores the danger.
Researchers can use multiple testing and multiple modeling until they find an exciting result to submit to the editors and referees of a professional journal—in other words, they can p-hack.40 Editors and referees have an incentive to trust, with too much complacence, that researchers have done due statistical diligence, so they can publish exciting papers and have their journal recognized in the mass media.41 Some editors are part of the problem.42
FFQs and cohort studies, in other words, have been afflicted by the irreproducibility crisis of modern science.
The Irreproducibility Crisis of Modern Science
Nutritional epidemiology’s combination of sloppy statistics and complaisant editorial practices is a component of the larger irreproducibility crisis, which has led to the mass production and publication of irreproducible research.43 Many improper scientific practices contribute to the irreproducibility crisis, including poor applied statistical methodology, bias in data reporting, publication bias (the skew toward publishing exciting, positive results), fitting the hypotheses to the data, and endemic groupthink.44 Far too many scientists use improper scientific practices, including an unfortunate portion who commit deliberate data falsification.45 The entire incentive structure of the modern complex of scientific research and regulation now promotes the mass production of irreproducible research.46 (For a longer discussion of the irreproducibility crisis, see Appendix 3.)
Many scientists themselves have lost overall confidence in the body of claims made in scientific literature.47 The ultimately arbitrary decision to declare p<0.05 as the standard of “statistical significance” has contributed extraordinarily to this crisis. Most cogently, Boos and Stefanski have shown that an initial result likely will not replicate at p<0.05 unless it possesses a p-value below 0.01, or even 0.001.48 Numerous other critiques about the p<0.05 problem have been published.49 Many scientists now advocate changing the definition of statistical significance to p<0.005.50 But even here, these authors assume only one statistical test and near perfect study methods.
Researchers themselves have become increasingly skeptical of the reliability of claims made in contemporary published research.51 A 2016 survey found that 90% of surveyed researchers believed that research was subject to either a major (52%) or a minor (38%) crisis in reliability.52 Begley reported in Nature that 47 of 53 research results in experimental biology could not be replicated.53 A coalescing consensus of scientific professionals realizes that a large portion of “statistically significant” claims in scientific publications, perhaps even a majority in some disciplines, are false—and certainly should not be trusted until they are reproduced.54
Yet federal regulatory agencies are too credulous—including the FDA.
Reforming Government Regulatory Policy: The Shifting Sands Project
The National Association of Scholars’ (NAS) project Shifting Sands: Unsound Science and Unsafe Regulationexamines how irreproducible science negatively affects select areas of government policy and regulation governed by different federal agencies.55 We also aim to demonstrate procedures which can detect irreproducible research. We believe government agencies should incorporate these procedures as they determine what constitutes “best available science”—the standard that judges which research should inform government regulation.56
Shifting Sands aims to demonstrate that the irreproducibility crisis has affected so broad a range of government regulation and policy that government agencies should now engage in thoroughgoing modernization of the procedures by which they judge “best available science.” Agency regulations should address all aspects of irreproducible research, including the inability to reproduce:
● the research processes of investigations;
● the results of investigations; and
● the interpretation of results.57
In Shifting Sands we use a single analysis strategy for all of our policy papers⸺p-value plotting (a visual form of Multiple Testing and Multiple Modeling analysis)⸺as a way to demonstrate weaknesses in different agencies’ use of meta-analyses. Our common approach supports a comparative analysis across different subject areas, while allowing for a focused examination of one dimension of the impact of the irreproducibility crisis on government agencies’ policies and regulations.
Our first Shifting Sands policy paper, Keeping Count of Government Science: P-Value Plotting, P-Hacking, and PM2.5Regulation, focused on irreproducible research in the field of environmental epidemiology that informs the Environmental Protection Agency’s (EPA) policies and regulations.58
This second policy paper in the Shifting Sands project focuses on irreproducible research in the field of nutritional epidemiology, which informs much of the U.S. Food and Drug Administration’s (FDA) nutrition policy. Our report builds upon the existing professional critique of nutritional epidemiology, which has concluded that the discipline does not impose rigorous controls upon its analytical procedures.59 A nutrition researcher can modify an analysis strategy after he has begun to examine data, examine multiple outcomes, use multiple variables as predictors, and further adjust an analysis by deciding whether to include multiple covariates in his model. Nutrition research scarcely ever uses a preregistered, written protocol.60 The discipline consists largely of exploratory research—even though it uses methodologies that ought to be confined to confirmatory research.61
Flimsy Food Findings applies the methodology of p-value plotting and simple counting to critique:
- a meta-analysis of the relationship between red and processed meats and health outcomes such as mortality, cancers and diabetes;62 and
- a meta-analysis of the relationship between soy protein intake and lipid markers (LDL cholesterol and other cholesterol markers) as surrogates for cardiovascular disease (CVD) risk reduction.63
In addition to this section, which draws on two technical studies that have been submitted for professional publication,64 other sections in this report include:
1) background on the U.S. Food and Drug Administration;
2) methods;
3) results;
4) discussion (including research integrity violations);
5) our recommendations for policy changes; and
6) methodological appendices, drawn both from material presented in the first Shifting Sands report and from new research.
Our policy recommendations include both specific technical recommendations directly following from our technical analyses, and broader policy recommendations to address the larger effects of the irreproducibility crisis on nutritional epidemiology, the scientific disciplines as a whole, and federal regulatory policy.
The FDA: Best Existing Practice in the Government?
Our analysis includes a case study of soy protein, currently under consideration by the FDA. The FDA’s initial determination is to remove the claim that soy protein provides a health benefit. Our research supports the FDA’s initial determination. We believe FDA procedures still need to be improved,65 but we note that our methodology in this case lends further support to a federal regulatory decision. We are glad that the evidence indicates that in this case the FDA is headed toward a correct decision.
Until such time as government agencies radically change their procedures to address the irreproducibility crisis, they should at least adopt Best Existing Practices within the government. These may well be the FDA’s.
U.S. Food and Drug Administration (FDA)
History and Role of the U.S. Food and Drug Administration
The administrative origin of the United States Food and Drug Administration (FDA) traces back to 1862, when the Department of Agriculture instituted a new Bureau of Chemistry. Successive acts of legislation, including the Food and Drugs Act (1906), the Federal Food, Drug, and Cosmetic Act (1938), the Kefauver-Harris Drug Amendments (1962), the Nutrition Labeling and Education Act (1990), the Dietary Supplement Health and Education Act (1994), and theFood and Drug Administration Modernization Act (1997), have expanded its remit and modernized the regulatory tools at its disposal.66 The FDA now regulates about 78% of the food ingested by Americans.67
The FDA now regulates about 78% of the food ingested by Americans.
After World War II, and particularly in the aftermath of the Thalidomide scandal of the later 1950s and early 1960s, the FDA’s mandate to enforce drug safety prompted it to adopt rigorous requirements for study design, centered upon the gold standard of the randomized clinical trial, and equally rigorous requirements for statistical analyses of the data. It adopted these techniques to fulfil the somewhat vague legislative mandate to assess “substantial evidence” by means of “adequate and well-controlled studies.” The FDA chose these techniques partly for their technical efficacy and partly because they would pass judicial muster when private manufacturers submitted legal challenges to the scientific validity of FDA regulations.68
Since the 1960s, the FDA has reviewed its study design and statistical analysis standards regularly. In collaboration with private industry and academic researchers, it has updated them to match the evolving best practices of scientific research.69
The FDA, as indicated by its name, also has been concerned with food safety for more than a century. Its continuingremit to protect American public health includes ensuring safety of the food supply.70 Both the U.S. Federal Food, Drug and Cosmetic Act (1938) and the Food and Drug Administration Modernization Act (1997) authorize the FDA to regulate health claims—any claim made on the label or in the labeling of a food that expressly or by implication characterizes the relationship of any substance to a disease or health condition.71 The FDA considers any statements on labels judged false or misleading by a significant scientific agreement among qualified experts to be “misbranding”.
The 1990s wave of legislation (the Nutrition Labeling and Education Act (1990), the Dietary Supplement Health and Education Act (1994), and the Food and Drug Administration Modernization Act (1997)) were intended to improve consumers’ health and well-being by providing them scientifically solid information about the foods they eat. They highlighted the salience of study design and statistical analysis, pioneered for drug regulation, and for the more broad and intensive food regulation required by these laws.
The FDA now requires that foods (except for meat from livestock, poultry and some egg products, which are regulated by the U.S. Department of Agriculture) be safe, wholesome, sanitary, and properly labeled.72 The FDA’s labeling requirements include mention of health claims that characterize the relationship between a substance (e.g., a food or food component) and a health benefit, a disease (e.g., cancer or cardiovascular disease), or a health condition (e.g., high blood pressure).73
These health claims, whether for good or for ill, must survive an FDA assessment based on rigorous study design and valid statistical analysis. (So too must nutrient content claims and structure/function claims.) The FDA articulates its regulatory requirements by means of a lengthy catalog of highly detailed Guidance Documents.74
Some research suggests that even scientifically accurate labels can be misleading and have limited ability to improve consumer health.75 But the general frailties of the discipline of nutritional epidemiology mean that not all labels are accurate, or even relevant.
Nutritional Epidemiology
FDA regulatory requirements require that evidence to support a health claim should be based on studies in humans.76 The randomized controlled trial (RCT), especially the randomized, placebo-controlled, double-blind intervention study, provides the strongest evidence among studies in humans.77 The best RCT certainly trumps the best observational study—and one might argue that a very indifferent RCT is still superior to the best observational study.78 Yet not all intervention studies on food and food components are RCTs, and frequently an RCT is unavailable and/or impractical. In these cases, the FDA must rely on lower-quality observational studies. It relies especially on cohort studies, dependent on dietary assessments based on FFQ analyses, and now pervasive in nutritional epidemiology.79
The discipline of nutritional epidemiology plays a vital role in the FDA’s labeling requirements. The FDA uses nutritional epidemiology to provide compelling scientific information to support its dietary recommendations and more coercive regulations.80 Nutritional epidemiologists, other nutritional scientists, and food-policy analysts from the food industries, academia, and government, are all involved at some level in funding, approving, or conducting nutrition studies aimed at developing, supporting, and/or assessing health claims.81
Nutritional epidemiology applies epidemiological methods to the study at the population level of how diet affects health and disease in humans. Nutritional epidemiologists base most of their inferences about the role of diet (i.e., foods and nutrients) in causing or preventing chronic diseases on observational studies. Since the 1980s, food frequency questionnaires (FFQs), which are easy to use, place low burdens on participants, and aspire to capture long-term dietary intake, have become the most common method by which nutritional epidemiologists measure dietary intake in large observational study populations.82
Nutritional epidemiology suffers many weaknesses. Critics have long noted that nutritional epidemiology relies predominantly on observational data, which researchers generally judge to be less reliable than experimental data, and that this generally weakens its ability to establish causality.83 The discipline’s research findings are also afflicted by frequent alterations of study design, data acquisition methods, statistical analysis techiques, and reporting of results.84 Selective reporting proliferates in published observational studies; researchers routinely test many questions and models during a study, and then only report results that are interesting (i.e., statistically significant).85
Nutritional epidemiology’s research findings are also afflicted by systematic alteration of study design, data acquisition, statistical analysis, and reporting of results.
Additional problems that limit the ability of nutritional epidemiology to substantiate claims of causal associations include:
- causal associations are difficult to prove in so complex a process as dietary intake, which includes interactions and synergies across different dietary components;
- researcher flexibility allows estimates of food to be analyzed and presented in several ways—as individual food frequencies, food groups, nutrient indexes, and food-group-specific nutrient indexes;
- researcher flexibility also allows dietary assessments to be presented with or without various adjustment factors, including other correlated foods and nutrients;
- researcher flexibility allows scientists to choose among the many nutrient−disease hypotheses that could be tested; and
- classic criteria for causation are often not met by nutritional epidemiologic studies, in large part because many dietary factors are weak and do not show linear dose-response relationships with disease risk within the range of exposures commonly found in the population.86
FDA Guidance Documents acknowledge the shortcomings of food consumption surveys, including FFQs, and generally note that observational studies are less reliable than intervention studies—but still allow FFQs to inform FDA regulations.87 And even published assessments of shortcomings in nutritional epidemiology procedures88 usually overlook the problems posed by multiple analysis.
Lack of Proper Multiplicity Control
The FDA does acknowledge some dangers from multiplicity analysis, notably in its Multiple Endpoints in Clinical Trials Guidance for Industry.89 Yet nutritional epidemiology suffers from the type of flawed statistical analysis that predictably and chronically inflates claims of statistical significance by failing to adjust for MTMM and by allowing researchers to search for results that are "statistically significant". Scientists have made these points repeatedly in professional and popular venues.90
The FDA’s health claim reviews examine factors including whether studies are controlled for bias and confounding variables, appropriateness of a study population, soundness of the experimental design and analysis, use of appropriate statistical analysis, and estimates of intake.91 These “reviews” do not address the MTMM problem. Nor do they compare the given analysis to a protocol analysis.
Consequences
Inaccurate labels can mislead consumers, not least by encouraging them to adopt fad diets that present health risks.92 Furthermore, every company in the food sector, which involved $6.22 trillion dollars in annual sales in 2020,93 depends for its livelihood on accurate labeling of food products. Mislabeling health benefits can give a company a larger market share than it deserves.
To take a more concrete example, the Code of Federal Regulations declares that “The scientific evidence establishes that diets high in saturated fat and cholesterol are associated with increased levels of blood total- and LDL-cholesterol and, thus, with increased risk of coronary heart disease,” and allows companies to make corollary health claims about reducing the risk of heart disease.94 The FDA duly notes on its Interactive Nutrition Facts Label that “Diets higher in saturated fat are associated with an increased risk of developing cardiovascular disease.”95
Yet recent research concludes that “Numerous meta-analyses and systematic reviews of both the historical and current literature reveals that the saturated-fat diet-heart hypothesis was not, and still is not, supported by the evidence. There appears to be no consistent benefit to all-cause or CVD mortality from the reduction of dietary saturated fat.”96 The law rather than the FDA’s approach to statistics was at issue here, but the financial consequences have been enormous: consumers have redirected billions of dollars toward producers of foods with less saturated fats, for a diet that may have no discernible health benefit.97
Case Studies
Our report uses p-value plotting, a method that has the potential to aid the FDA in reviewing nutritional health claims. We now demonstrate how this method works by applying the methodology of p-value plotting to critique:
- a meta-analysis of the relationship between red and processed meats and health outcomes such as mortality, cancers and diabetes;98 and
- a meta-analysis of the relationship between soy protein intake and lipid markers (LDL cholesterol and other cholesterol markers) as surrogates for cardiovascular disease (CVD) risk reduction.99
The second case study analyzes a topic currently under review by the FDA. The FDA has permitted soy protein products to display a heart health label based on soy protein’s claimed ability to lower cholesterol. The FDA now is considering whether to revoke the claim, originally allowed in 1999, due to a perceived lack of consistent low-density lipoprotein (LDL) cholesterol reduction in randomized controlled trials.100
Methods
General Approach for Study Analysis
The general approach that we used in our technical studies parallels the work of scholars such as Peace et al.101 We investigated the statistical reliability of methods used in nutritional epidemiology meta-analyses that utilize FFQ studies on cohort populations. Meta-analysis is a systematic procedure for statistically combining data from multiple studies that address a common research question, such as whether a particular food has an association with a disease (e.g., cancer).102
Peace et al. (2018) evaluated 10 published studies (base study papers) included in a meta-analysis of the association between ingestion of sugar-sweetened beverages and the risk of metabolic syndrome and type 2 diabetes.103 Peace et al. observed that the number of foods ranged from 60 to 165 across the 10 base study papers, and that none of the base study papers corrected for multiple testing or multiple modeling (MTMM) to account for chance findings.
The estimated number of statistical tests (or question asked on a same data set) can be referred to as “counts” or “analysis search space”.104 Counts/analysis search space for papers used in the Peace evaluation ranged from 3,072 to over 117 million.105 Again, we point out that five percent of questions asked in these studies works out to large numbers of signals of surprise (chance) findings! Peace et al. noted that paired with every p-value was an estimated effect. Any effect value from a base paper used in meta-analysis could well be a chance finding; the resulting meta-analytic statistic could equally well be biased.106
Consider the following example. If students are arranged from tallest to shortest and their heights recorded in the same order, we have a set of order statistics. We now consider more deeply the consequence of using order statistics such as a largest effect value (the largest order statistic), the expected values of order statistics, and their relation to p-values as a function of the number of observations in a sample (i.e., sample size). If we take a random sample from a population, and order the objects from smallest to largest, we denominate the reordered objects as “order statistics.” The value of the largest order statistic in the random sample is the largest number in the sample. The larger the sample size, N, taken from a population, the larger the deviation from the population mean the largest object's expected value will be. (See Figure 2.)
Figure 2: Expected value of largest order statistics and corresponding P-value for a sample size N from a normal distribution with a standard deviation of one107
|
N |
Expected deviation |
P-value |
|
30 |
2.043 |
0.04952 |
|
60 |
2.319 |
0.02709 |
|
100 |
2.508 |
0.01720 |
|
200 |
2.746 |
0.00919 |
|
350 |
2.927 |
0.00551 |
|
400 |
2.968 |
0.00487 |
|
1000 |
3.241 |
0.00119 |
|
5000 |
3.678 |
0.00024 |
This table shows, for instance, that if 1,000 different objects are drawn from the target population, the largest order statistic, on average, will lie 3.241 standard deviations away from the population mean, and will be extremely “significantly different” (p = .00119) from the population mean. A misinterpretation occurs in thinking that the largest order statistic can be used to represent an average of a group characteristic (i.e., the population mean). It does not.
Researchers who select “statistically significant” results from a multitude of possibilities essentially use an order statistic from a study to make a research claim. Meta-analysts in turn mistakenly take the order statistic to be a reliable number, which substantially affects the results of their meta-analysis. Unless allowance is made for the large sample space (i.e., MTMM corrections), misleading results are virtually certain to occur. We view meta-analysis computations as not robust. We believe our work is the first to highlight just how seriously a few p-hacked base studies can distort meta-analysis computations.108
We chose one meta-analysis of red meat and processed meat that used observational base studies109 and one meta-analysis of soy protein that used RCT base studies110 as representative of nutritional epidemiologic work in this area. We also chose the soy protein study because the FDA is currently considering policy in this area. We believe that problems with these studies likely plague most nutritional meta-analysis studies.
P-value Plots
Epidemiologists traditionally use confidence intervals instead of p-values from a hypothesis test to demonstrate or interpret statistical significance. Since researchers construct both confidence intervals and p-values from the same data, the one can be calculated from the other.111 We first calculated p-values from confidence intervals for all data used by Vernooij et al. (red and processed meats) and by Blanco Mejia et al. (soy protein, FDA case study).
We then developed p-value plots, a method for correcting Multiple Testing and Multiple Modeling (MTMM), to inspect the distribution of the set of p-values.112 (For a longer discussion of p-value plots, see Appendix 4.) The p-value is a random variable derived from a distribution of the test statistic used to analyze data and to test a null hypothesis. In a well-designed study, the p-value is distributed uniformly over the interval 0 to 1 regardless of sample size under the null hypothesis and the distribution of true null hypothesis points in a p-value plot should form a straight line.113
A plot of p-values corresponding to a true null hypothesis, when sorted and plotted against their ranks, should conform to a near 45-degree line. Researchers can use the plot to assess the reliability of base study papers used in meta-analyses. (For a longer discussion of meta-analyses, see Appendix 5.)
We constructed and interpreted p-value plots as follows:
● We computed and ordered p-values from smallest to largest and plotted them against the integers, 1, 2, 3, …
● If the points on the plot followed an approximate 45-degree line, we concluded that the p-values resulted from a random (chance) process, and that the data therefore supported the null hypothesis of no significant association.
● If the points on the plot followed approximately a line with a flat/shallow slope, where most of the p-values were small (less than 0.05), then the p-values provided evidence for a real (statistically significant) association.
● If the points on the plot exhibited a bilinear shape (divided into two lines), then the p-values used for meta-analysis are consistent with a two-component mixture and a general (over-all) claim is not supported; in addition, the p-value reported for the overall claim in the meta-analysis paper cannot be taken as valid.114
P-value plotting is not itself a cure-all. P-value plotting cannot detect every form of systematic error. P-hacking, research integrity violations, and publication bias will alter a p-value plot. But it is a useful tool which allows us to detect a strong likelihood that questionable research procedures, such as HARKing and p-hacking, have corrupted base studies used in meta-analysis and therefore rendered the meta-analysis unreliable. We may also use it to plot “missing papers” in a body of research, and thus to infer that publication bias has affected a body of literature.
We may also use p-value plotting to plot “missing papers” in a body of research, and thus to infer that publication bias has affected a body of literature.
To HARK is to hypothesize after the results are known—to look at the data first and then come up with a hypothesis that has a statistically significant result.115 (For a longer discussion of HARKing, see Appendix 6.)
P-hacking involves the relentless search for statistical significance and comes in many forms, including multiple testing and multiple modeling without appropriate statistical correction.116 It enables researchers to find nominally statistically significant results even when there is no real effect; to convert a fluke, false positive into a "statistically significant" result.117
Irreproducible research hypotheses produced by HARKing and p-hacking send whole disciplines chasing down rabbit holes. It allows scientists to pretend their “follow-up” research is confirmatory research; but in reality, their researchproduces nothing more than another highly tentative piece of exploratory research.118 In effect, bad techniques can lead to bad (irreproducible) claims.
P-value plotting is not the only means available by which to detect questionable research procedures. Scientists have come up with a broad variety of statistical tests to account for frailties in base studies as they compute meta-analyses. Unfortunately, questionable research procedures in base studies severely degrade the utility of the existing means of detection.119 We proffer p-value plotting not as the first means to detect HARKing and p-hacking in meta-analysis, but as a better means than alternatives which have proven ineffective.
Counting
Initially, we want to give readers a general understanding of how commonly FFQ data are used by researchers investigating health outcomes in the literature. The problem, as we have partially explained previously, is that researchers using FFQs—which are typically used in cohort studies—can subject their data to MTMM120 and produce large numbers of false positive results. To understand how commonly FFQ data are used, we used a Google Scholar (GS) search of the literature to estimate the number of citations with the exact phrase “food frequency questionnaire” and a particular “health outcome” (explained below).
We chose 18 health outcomes for this search component, including: obesity, inflammation, depression, mental health, all-cause mortality, high blood pressure, lung and other cancers, metabolic disorders, low birth weight, pneumonia, autism, suicide, COPD (i.e., chronic obstructive pulmonary disease), ADHD (i.e., attention-deficit/hyperactivity disorder), miscarriage, atopic dermatitis, reproductive outcomes, and erectile dysfunction.
Secondly, it is important to get some sense of the number of research questions under consideration in any given cohort study. It is time-consuming and expensive to set up and follow a cohort. But it is relatively inexpensive to add new measurements and research questions to an existing cohort. For those reasons, it is typical to have many research questions under consideration with a given cohort study. Any single paper coming from a cohort study might appear only focused on one question. However, there are almost always many questions at issue: the same cohort can be used repeatedly for different research purposes. When scientists produce many papers from the data of a single cohort study, and do not take explicit notice of their procedures and the necessary statistical corrections, it strongly suggests they have not corrected for MTMM.
We have focused on counting three categories that are central concerns of the Vernooij et al. and Blanco Mejia meta-analyses:
● Number of foods listed in food frequency questionnaires (FFQ) used in the base study papers. Very often a FFQ is part of a cohort study. People in the cohort are asked which foods they consumed, and often also asked the quantity consumed. A FFQ usually lists more than 60 foods, sometimes hundreds. If there are many foods and many health outcomes of interest, we should expect many claims at issue and many resulting papers. So, if a particular paper reports only one outcome and one cause, we are likely only seeing a small fraction of the number of claims under consideration.
● Number of questions considered in base study papers. For this, as we explained previously, we counted the causes (C), outcomes (O), and yes/no adjustment factors (A); where the number of questions = C × O × 2^A.
● Number of published papers for each cohort study used in the base study papers. We used a Google Scholar search to estimate the number of papers that contain the data set used by the cohort study. We preferred to be conservative in this estimate, so, for some data sets, we restricted the Google Scholar search to the paper’s title.
Figure 3: Google Scholar Search of Health Effects' Association with Foods121
|
RowID |
Outcome |
# of citations |
|
1 |
obesity |
42,600 |
|
2 |
inflammation |
23,100 |
|
3 |
depression |
18,000 |
|
4 |
mental health |
10,900 |
|
5 |
all-cause mortality |
10,700 |
|
6 |
high blood pressure |
9,470 |
|
7 |
lung and other cancers |
7,180 |
|
8 |
metabolic disorders |
5,480 |
|
9 |
low birth weight |
4,630 |
|
10 |
pneumonia |
2,140 |
|
11 |
autism |
2,080 |
|
12 |
suicide |
1,840 |
|
13 |
COPD |
1,800 |
|
14 |
ADHD |
1,370 |
|
15 |
miscarriage |
1,240 |
|
16 |
atopic dermatitis |
938 |
|
17 |
reproductive outcomes |
537 |
|
18 |
erectile dysfunction |
359 |
Figure 3 shows how frequently researchers use FFQ data to investigate 18 separate health outcomes. Scientists appear particularly interested in investigating the association between obesity and particular foods, but they also investigate more unexpected topics, such as the association between particular foods and erectile dysfunction. They are, as a group, thorough in seeking out possible associations.
Case Study #1: Red and Processed Meats
Introduction
The Johnston research group (Vernooij et al.) recently published a systematic review and meta-analysis of cohort studies pertaining to food health claims of red and processed meat.122 We selected 6 of 30 health outcomes that they reported on for further investigation: all-cause mortality, cancer mortality and incidence, cardiovascular mortality, nonfatal coronary heart disease, fatal and nonfatal myocardial infarction, and type 2 diabetes. We chose the 6 health outcomes studied most frequently in the base study papers.
Upon our request, the Johnston research group generously provided the data that we used for this report. We then used analysis search space counting123 and p-value plots124 to assess the claims about the health effects of red meat and processed meat.
Data Sets
The Johnston research group’s (Vernooij et al.) systematic review and meta-analysis reviewed 1,501 papers and selected 105 primary papers for further analysis. The data set included 70 study cohorts.125 The researchers used GRADE (Grading of Recommendations Assessment, Development and Evaluation) criteria126—which do not assess MTMM—to assess the reliability of the papers drawn from published literature and to select papers for their meta-analysis. Their study complied with the recommendations of PRISMA (Preferred Reporting Items for Systematic reviews and Meta-Analyses).127
Vernooij et al. stated that the base study papers used in their meta-analysis, which were observational studies, provided low- or very-low-certainty evidence according to the GRADE criteria. Vernooij et al. concluded that, “Low- or very-low-certainty evidence suggests that dietary patterns with less red and processed meat intake may result in very small reductions in adverse cardiometabolic and cancer outcomes.”128 In other words, their meta-analysis ascribed little confidence to the claim that decreased consumption of red meat or processed meat improves health.129
Results
Below we present results of our technical investigation about the association between red and processed meat with six health outcomes reported by Vernooij et al.130 We present a summary of the characteristics of the 15 base study papers we randomly selected from 105 Vernooij et al. base study papers in Figure 4.
Counting
We randomly selected 15 of the 105 base study papers (14%) for counting purposes. A 5—20% sample from a population whose characteristics are known is considered acceptable for most research purposes as it provides an ability to make generalizations for the population.131 We accepted Vernooij et al.’s judgment that their screening procedures selected 105 base study papers with sufficiently consistent characteristics for use in meta-analysis.
Figure 4: Characteristics of 15 Randomly Selected Papers from Vernooij et al.132
|
Citation# |
Base Paper 1st Author |
Year |
Foods |
Outcomes |
Causes (Predictors) |
Yes/no Adjustment Factors (Covariates) |
Tests |
Models |
Search Space |
|
8 |
Dixon |
2004 |
51 |
3 |
51 |
17 |
153 |
131,072 |
20,054,016 |
|
31 |
McNaughton |
2009 |
127 |
1 |
22 |
3 |
22 |
8 |
176 |
|
34 |
Panagiotakos |
2009 |
156 |
3 |
15 |
11 |
45 |
2,048 |
92,160 |
|
38 |
Héroux |
2010 |
18 |
32 |
18 |
9 |
576 |
512 |
294,912 |
|
47 |
Akbaraly |
2013 |
127 |
5 |
4 |
5 |
20 |
32 |
640 |
|
48 |
Chan |
2013 |
280 |
1 |
34 |
10 |
34 |
1,024 |
34,816 |
|
49 |
Chen |
2013 |
39 |
4 |
12 |
5 |
48 |
32 |
1,536 |
|
53 |
Maruyama |
2013 |
40 |
6 |
30 |
11 |
180 |
2,048 |
368,640 |
|
56 |
George |
2014 |
122 |
3 |
20 |
13 |
60 |
8,192 |
491,520 |
|
57 |
Kumagai |
2014 |
40 |
3 |
12 |
8 |
36 |
256 |
9,216 |
|
59 |
Pastorino |
2016 |
45 |
1 |
10 |
6 |
10 |
64 |
640 |
|
65 |
Lacoppidan |
2015 |
192 |
1 |
6 |
16 |
6 |
65,536 |
393,216 |
|
80 |
Lv |
2017 |
12 |
3 |
27 |
8 |
81 |
256 |
20,736 |
|
92 |
Chang-Claude |
2005 |
14 |
5 |
3 |
7 |
15 |
128 |
1,920 |
|
99 |
Tonstad |
2013 |
130 |
1 |
4 |
10 |
4 |
1,024 |
4,096 |
We note that while Willett’s early food frequency questionnaire (FFQ) studies investigated only 61 foods,133 these 15 base studies include FFQ−cohort studies examining as many as 280 foods134 and 32 different health outcomes.135
We present summary statistics of the 15 base study papers we randomly selected from 105 Vernooij et al. base study papers in Figure 5.
Figure 5: Summary statistics of 15 randomly selected papers from Vernooij et al.136
|
Statistic |
Foods |
Outcomes |
Causes (Predictors) |
Yes/no Adjustment Factors (Covariates) |
Tests |
Models |
Search Space |
|
minimum |
12 |
1 |
3 |
3 |
4 |
8 |
176 |
|
lower quartile |
40 |
1 |
8 |
7 |
18 |
96 |
1,728 |
|
median |
51 |
3 |
15 |
9 |
36 |
512 |
20,736 |
|
upper quartile |
129 |
5 |
25 |
11 |
71 |
2,048 |
331,776 |
|
maximum |
280 |
32 |
51 |
17 |
576 |
131,072 |
20,054,016 |
|
mean |
93 |
5 |
18 |
9 |
86 |
14,149 |
1,451,216 |
We emphasize that the median number of causes (predictors) was 15 and the median number of adjustment factors (covariates) was 9. These numbers by themselves suggest the great scope of the search space.
Nutritional epidemiologists have tended to believe they gain an advantage by studying large numbers of outcomes, predictors, and covariates, on the presumption that this procedure maximizes their chances of discovering risk factor−health outcome associations.137 What they have maximized, rather, is their likelihood of registering a false positive. The median search space for the 15 randomly selected base study papers was 20,736. (See Figure 5.) We may calculate that 5 percent of these 20,736 possible questions asked of a single typical FFQ−cohort data set underlying a nutritional epidemiology (observational) study will equal 1,036 chance findings that unwary researchers can take for a statistically significant result.
We also wished to estimate the number of published papers for each cohort study that informed the 15 randomly sampled base study papers, as more evidence that MTMM is not taken into account. In Figure 6 we present cohort study names, an estimate of the number of papers in the Google Scholar literature for each cohort, and an estimate of the number of papers in the Google Scholar literature for each cohort using FFQs.
Figure 6: Cohort study names, an estimate of papers in literature for each cohort, and an estimate of papers in literature cohort using FFQs for the 15 randomly sampled base study papers of Vernooij et al.138
|
Citation# |
Author |
Year |
Cohort Study Name |
Papers |
Papers, Cohort+FFQ |
|
48 |
Chan |
2013 |
Mr. Os and Ms. Os (Hong Kong) |
38,000 |
8 |
|
56 |
George |
2014 |
WHI Women’s Health Initiative Observational Study |
37,200 |
1,520 |
|
49 |
Chen |
2013 |
HEALS and ‘Bangladesh’ |
12,400 |
1,080 |
|
53 |
Maruyama |
2013 |
JACC Japan Collaborative Cohort |
4,740 |
758 |
|
57 |
Kumagai |
2014 |
NHI Ohsaki National Health Insurance Cohort |
4,270 |
122 |
|
47 |
Akbaraly |
2013 |
Whitehall II study |
4,160 |
1,800 |
|
99 |
Tonstad |
2013 |
Adventist Health Study-2 |
2,630 |
653 |
|
80 |
Lv |
2017 |
China Kadoorie Biobank |
2,480 |
143 |
|
59 |
Pastorino |
2016 |
MRC National Survey of Health and Development |
1,860 |
148 |
|
31 |
McNaughton |
2009 |
Whitehall II study |
1,800 |
1,800 |
|
34 |
Panagiotakos |
2009 |
ATTICA Study |
1,650 |
1,650 |
|
8 |
Dixon |
2004 |
DIETSCAN (Dietary Patterns and Cancer Project) |
1,080 |
1,080 |
|
38 |
Héroux |
2010 |
ACLS (Aerobics Center Longitudinal Study) |
619 |
167 |
|
65 |
Lacoppidan |
2015 |
Diet, Cancer, and Health (DCH) cohort |
292 |
116 |
|
92 |
Chang-Claude |
2005 |
German vegetarian study |
18 |
13 |
Researchers evidently conducted large quantities of statistical testing on the data from each cohort. Yet none of these 15 base study papers provided correction for multiple statistical tests and multiple statistical models (MTMM) used on the same cohort−FFQ data set.
We present summary statistics for the 15 randomly sampled base study papers in Figure 7.
Figure 7: Summary statistics for estimate of papers in literature for the 15 randomly sampled base study papers of Vernooij et al.139
|
Statistic |
Papers |
Papers, Cohort+FFQ |
|
minimum |
18 |
8 |
|
lower quartile |
1,365 |
133 |
|
median |
2,480 |
653 |
|
upper quartile |
4,505 |
1,300 |
|
maximum |
38,000 |
1,800 |
|
mean |
7,547 |
737 |
Based upon the above information we have presented, we conclude that these researchers used cohort study databases to examine large numbers of questions, both in general and particularly for FFQs, while making no correction for MTMM. So far as we can tell, this practice is typical of the field.
P-Value Plots
Our technical investigation focused on six health outcomes analyzed by Vernooij et al., including all-cause mortality, cardiovascular mortality, overall cancer mortality, breast cancer incidence, colorectal cancer incidence, and Type 2 diabetes incidence. We constructed p-value plots for these six health outcomes. (See Figure 8.)
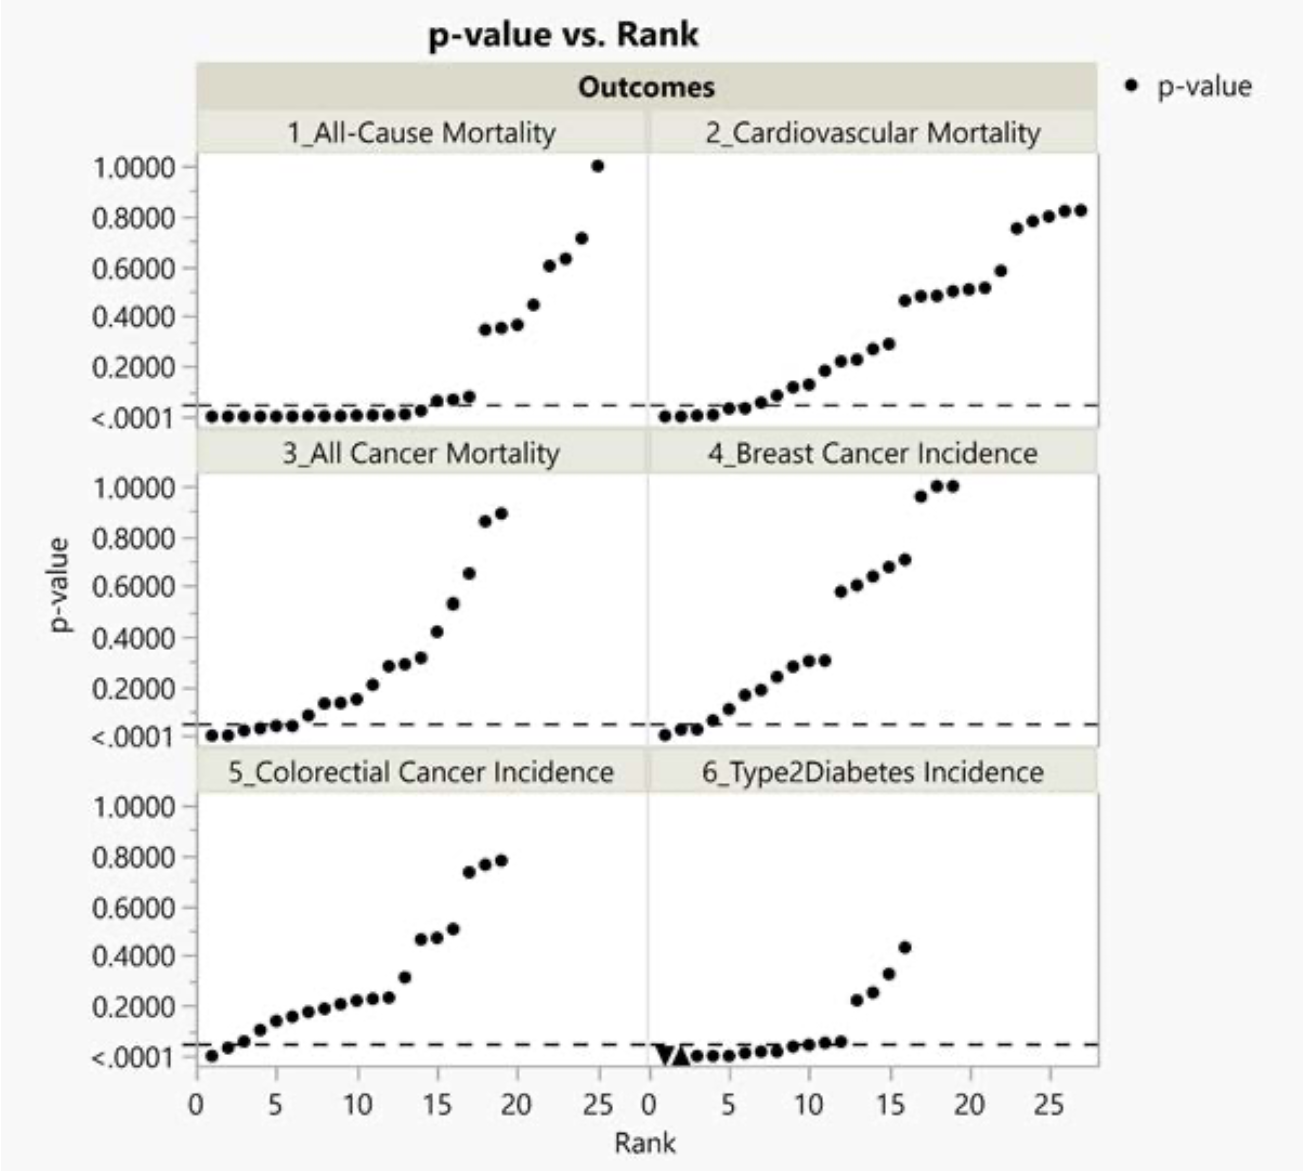
Figure 8: P-value plots for meta-analysis of six health outcomes from Vernooij et al.
Each of the six images in Figure 8 indexes rank order (the x axis) and p-value (the y axis). We have ordered the p-values the dots in the body of the six images from smallest to largest. The number of dots (p-values) in each image corresponds to the number of studies for each of the six health outcomes.
As noted in the Methods Section and in our previous work,140 if there is no effect the p-values will form roughly a 45-degree line. If the line is horizontal with most of the p-values small, then it supports a real effect. Finally, if the shape of the points is bilinear, then the results are ambiguous.
The p-value plots for all-cause mortality, cardiovascular mortality, overall cancer mortality and type 2 diabetes incidence appear bilinear, hence ambiguous.
The p-value plots for breast cancer incidence and colorectal cancer incidence appear as approximate 45⁰ lines, hence indicating a likelihood of no real association.
The plot for colorectal cancer incidence, it should be noted, is very unusual, with seven of the p-values on a roughly 45⁰ line, two below the 0.05 threshold, and one extremely small p-value (6.2E-05). Scholars usually take a p-value less than 0.001 as very strong evidence of a real effect, although some argue that very small p-values may indicate failures of research integrity.141 If the small p-values indicates a real effect, then p-values larger than 0.05 should be rare.
The sub-figure for Type 2 diabetes incidence (lower right-hand side) has a p-value plot appearance of a real effect. On closer examination of the p-values and associated measured effects, however, the two smallest p-values (4.1 x 10^-9 and 1.7 x 10^-7) have contrary results—the first is for a decrease of effect and the second is for an increase of effect. Our analysis suggests some support for a real association between red or processed meat and diabetes—but with the caution that the ambiguous results of the two smallest p-values makes us hesitant to endorse this result too strongly. We must note here a caution about research integrity,142 which we will discuss at greater length below.
Each health outcome presented in Figure 9 displays a wide range of p-value results. (See Figure 9.) In the meta-analysis of breast cancer incidence, for example, p-values ranged from <0.005 to 1 across 19 base studies (>2 orders of magnitude). In the meta-analysis of Type 2 diabetes incidence, the p-values ranged all the way from <5 x 10^-09 to 0.43 (>8 orders of magnitude). Such extraordinary ranges require a further caution about research integrity.
Figure 9: Minimum and maximum p-values for six health outcomes shown in Figure 9 from Vernooij et al.143
|
Health outcome |
Number of p-values |
Minimum p-value |
Maximum p-value |
|
All-cause mortality |
25 |
5.97E-12 |
1 |
|
Cardiovascular mortality |
27 |
6.43E-06 |
0.822757 |
|
Overall cancer mortality |
19 |
0.000318 |
0.889961 |
|
Breast cancer incidence |
19 |
0.002434 |
1 |
|
Colorectal cancer incidence |
19 |
6.2E-05 |
0.779478 |
|
Type 2 diabetes incidence |
16 |
4.1E-09 |
0.43304 |
The smallest p-value from Figure 10 is 6.0 x 10^-12—a value so small as to imply certainty.144 A p-value this small may register a true finding—and small p-values are more likely in studies with large sample sizes.145 Yet the wide range of p-values in similar studies, including several which register results far weaker than p<.05, means that we must consider alternative explanations. These include some form of bias (systematic alteration of research findings due to factors related to study design, data acquisition, and/or analysis or reporting of results)146 and data fabrication.
Selective reporting proliferates in published observational studies where researchers routinely test many questions and models during a study and then only report "supposedly statistically significant but false" results.147
We sought circumstantial evidence of such selective reporting. We therefore further investigated one of the six health outcomes in Figure 8—all-cause mortality—and identified all of the base cohort studies.148
We present these results in Figure 10 ranked by p-value, along with the Vernooij et al. risk ratios (RRs) and confidence limits (CLs) from which we computed the p-values. A cohort study typically examines many outcomes, predictors, and covariates. The larger the number of citations, the greater the number of outcomes examined on a cohort study.
Figure 10: Characteristics of 24149 cohort statistics for Vernooij et al. meta-analysis of all-cause mortality outcome150
|
Rank |
Citations |
RR |
CLlow |
CLhigh |
p-value |
Cohort Study Name |
|
1 |
1,390 |
1.49 |
1.33 |
1.67 |
5.97E-12 |
Shanghai Men's Health Study |
|
2 |
86,400 |
1.31 |
1.19 |
1.44 |
3.61E-08 |
Health Professionals' Follow-up Study |
|
3 |
6,270 |
1.25 |
1.15 |
1.36 |
1.56E-07 |
Adventist Health Study |
|
4 |
81,100 |
1.22 |
1.11 |
1.34 |
3.71E-05 |
Women's Health Initiative |
|
5 |
125,000 |
1.17 |
1.08 |
1.26 |
.000121 |
Nurses' Health Study |
|
6 |
270 |
1.20 |
1.09 |
1.34 |
.000202 |
Adventist Mortality Study |
|
7 |
5,580 |
1.14 |
1.06 |
1.23 |
.000406 |
Singapore Chinese Health Study |
|
8 |
2,160 |
1.33 |
1.12 |
1.58 |
.00114 |
Black Women's Health Study |
|
9 |
14,400 |
1.22 |
1.08 |
1.38 |
.00139 |
Swedish Women's Lifestyle and |
|
10 |
5,440 |
1.15 |
1.05 |
1.26 |
.00260 |
Shanghai Women's Health Study |
|
11 |
420 |
0.91 |
0.85 |
0.96 |
.00673 |
Japan Public Health Center-based Pro- |
|
12 |
85 |
0.90 |
0.83 |
0.98 |
.0108 |
Health Food Shoppers Study |
|
13 |
2,670 |
1.11 |
1.02 |
1.21 |
.0156 |
Adventist Health Study 2 (AHS-2) M |
|
14 |
136,000 |
1.43 |
1.04 |
1.96 |
.0277 |
Third National Health and Nutrition |
|
15 |
1,430 |
1.52 |
1.04 |
2.20 |
.0306 |
Seguimiento Universidad de Navarra |
|
16 |
2,670 |
1.10 |
1.00 |
1.21 |
.0500 |
Adventist Health Study 2 (AHS-2) W |
|
17 |
37,500 |
1.37 |
0.80 |
2.34 |
.251 |
European Prospective Investigation |
|
18 |
3,690 |
1.18 |
0.86 |
1.64 |
.305 |
Aerobics Center Longitudinal Study |
|
19 |
18 |
0.91 |
0.74 |
1.12 |
.371 |
German Vegetarian Study |
|
20 |
219,000 |
1.14 |
0.83 |
1.55 |
.418 |
Third National Health and Nutrition |
|
21 |
23,000 |
1.08 |
0.80 |
1.45 |
.615 |
Health, Aging, and Body Composition Study (Health ABC) |
|
22 |
31,400 |
1.05 |
0.82 |
1.35 |
.699 |
Whitehall II Study |
|
23 |
3,600 |
1.04 |
0.74 |
1.46 |
.821 |
PREvención con DIeta MEDiterránea |
|
24 |
587 |
1.00 |
0.87 |
1.15 |
1.000 |
Oxford Vegetarian Study |
The extraordinarily large number of citations associated with each cohort study provides substantial circumstantial evidence of selective reporting.
Case Study #2: Soy Protein/FDA Case Study
Introduction
For our second case study we chose to analyze Blanco Mejia et al.’s 2019 meta-analysis of soy protein base studies, which the FDA is using to decide whether to revoke the soy protein heart health claim.151 Blanco Mejia et al. performed a meta-analysis of 46 randomized controlled trials (RCTs) on men and women, which observed soy protein intake and lipid markers (LDL cholesterol and other cholesterol markers) as surrogates for cardiovascular disease (CVD) risk reduction.152
We focused our analysis on one aspect of their meta-analysis: LDL cholesterol as a surrogate for cardiovascular disease risk reduction. We used the same statistical strategy, analysis search space counting and p-value plots, to assess a soy protein intake-LDL cholesterol health claim.
Data Sets
Blanco Mejia et al. analyzed the 46 dietary randomized trials in humans concerning heart health listed by the FDA.153 Blanco Mejia et al. reviewed all 46 dietary trials (studies) in full and selected 43 studies providing 50 study comparison statistics to use for meta-assessment of the soy protein intake LDL cholesterol reduction health claim.
Blanco Mejia et al. concluded that, “soy protein lowers LDL cholesterol by a small but significant amount. Our data fit with the advice given to the general public internationally to increase plant protein intake.”154 The Blanco Mejia et al. meta-analysis supports the 1999 health claim.
Results
Below we present results of our technical investigation about the association between soy protein intake and LDL cholesterol reduction reported by Blanco Mejia et al.155
Counting
We randomly selected 9 of the 43 base study papers (21%) for counting purposes. As noted above, a 5-20% sample from a population whose characteristics are known is considered acceptable for most research purposes, as it provides an ability to generalize for the population.156 We also have accepted Blanco Mejia et al.’s judgment that their screening procedures selected 43 base study papers with sufficiently consistent characteristics for use in meta-analysis.
We present summary characteristics for the 9 RCT base study papers we randomly selected from the Blanco Mejia et al. 43 base study papers in Figure 11.
Figure 11: Characteristics of 9 randomly selected RCT papers from Blanco Mejia et al. (2019)157
|
Citation# |
Base Paper 1st Author |
Year |
Outcomes |
Causes (Predictors) |
Yes/noAdjustment Factors (Covariates) |
Tests |
Models |
Search Space |
|
15 |
Bakhit |
1994 |
8 |
5 |
3 |
40 |
8 |
320 |
|
19 |
Chen |
2006 |
9 |
1 |
4 |
9 |
16 |
144 |
|
33 |
Hori |
2001 |
20 |
1 |
0 |
20 |
1 |
20 |
|
36 |
Jenkins |
2000 |
14 |
1 |
0 |
14 |
1 |
14 |
|
41 |
Ma |
2005 |
20 |
6 |
0 |
120 |
1 |
120 |
|
43 |
Mangano |
2013 |
6 |
3 |
0 |
18 |
1 |
18 |
|
52 |
Takatsuka |
2000 |
10 |
2 |
0 |
20 |
1 |
20 |
|
56 |
Van Horn |
2001 |
3 |
4 |
1 |
12 |
2 |
24 |
|
60 |
Wong |
1998 |
14 |
4 |
3 |
56 |
8 |
448 |
The median search space of these 9 RCT base study papers was 24, a much smaller number than the median search space of 20,736 for the 15 of 105 Veernooij et al. observational base study papers that we counted. (See Figure 4.)
Although no study is likely on its own to prove causality, randomization in RCT design is intended to reduce bias and provide a more rigorous means than observational studies for examining cause-effect relationships between a risk factor/intervention and an outcome.158 Randomization promotes balancing of participant characteristics (both observed and unobserved) between the study groups allowing attribution of any differences in outcome to the study intervention. In theory, results of a meta-analysis of RCTs should be superior to those from a meta-analysis based on observational studies.159
P-Value Plots
We present the p-value plot for meta-analysis of the association between soy protein intake and LDL cholesterol reduction from Blanco Mejia et al. in Figure 12.
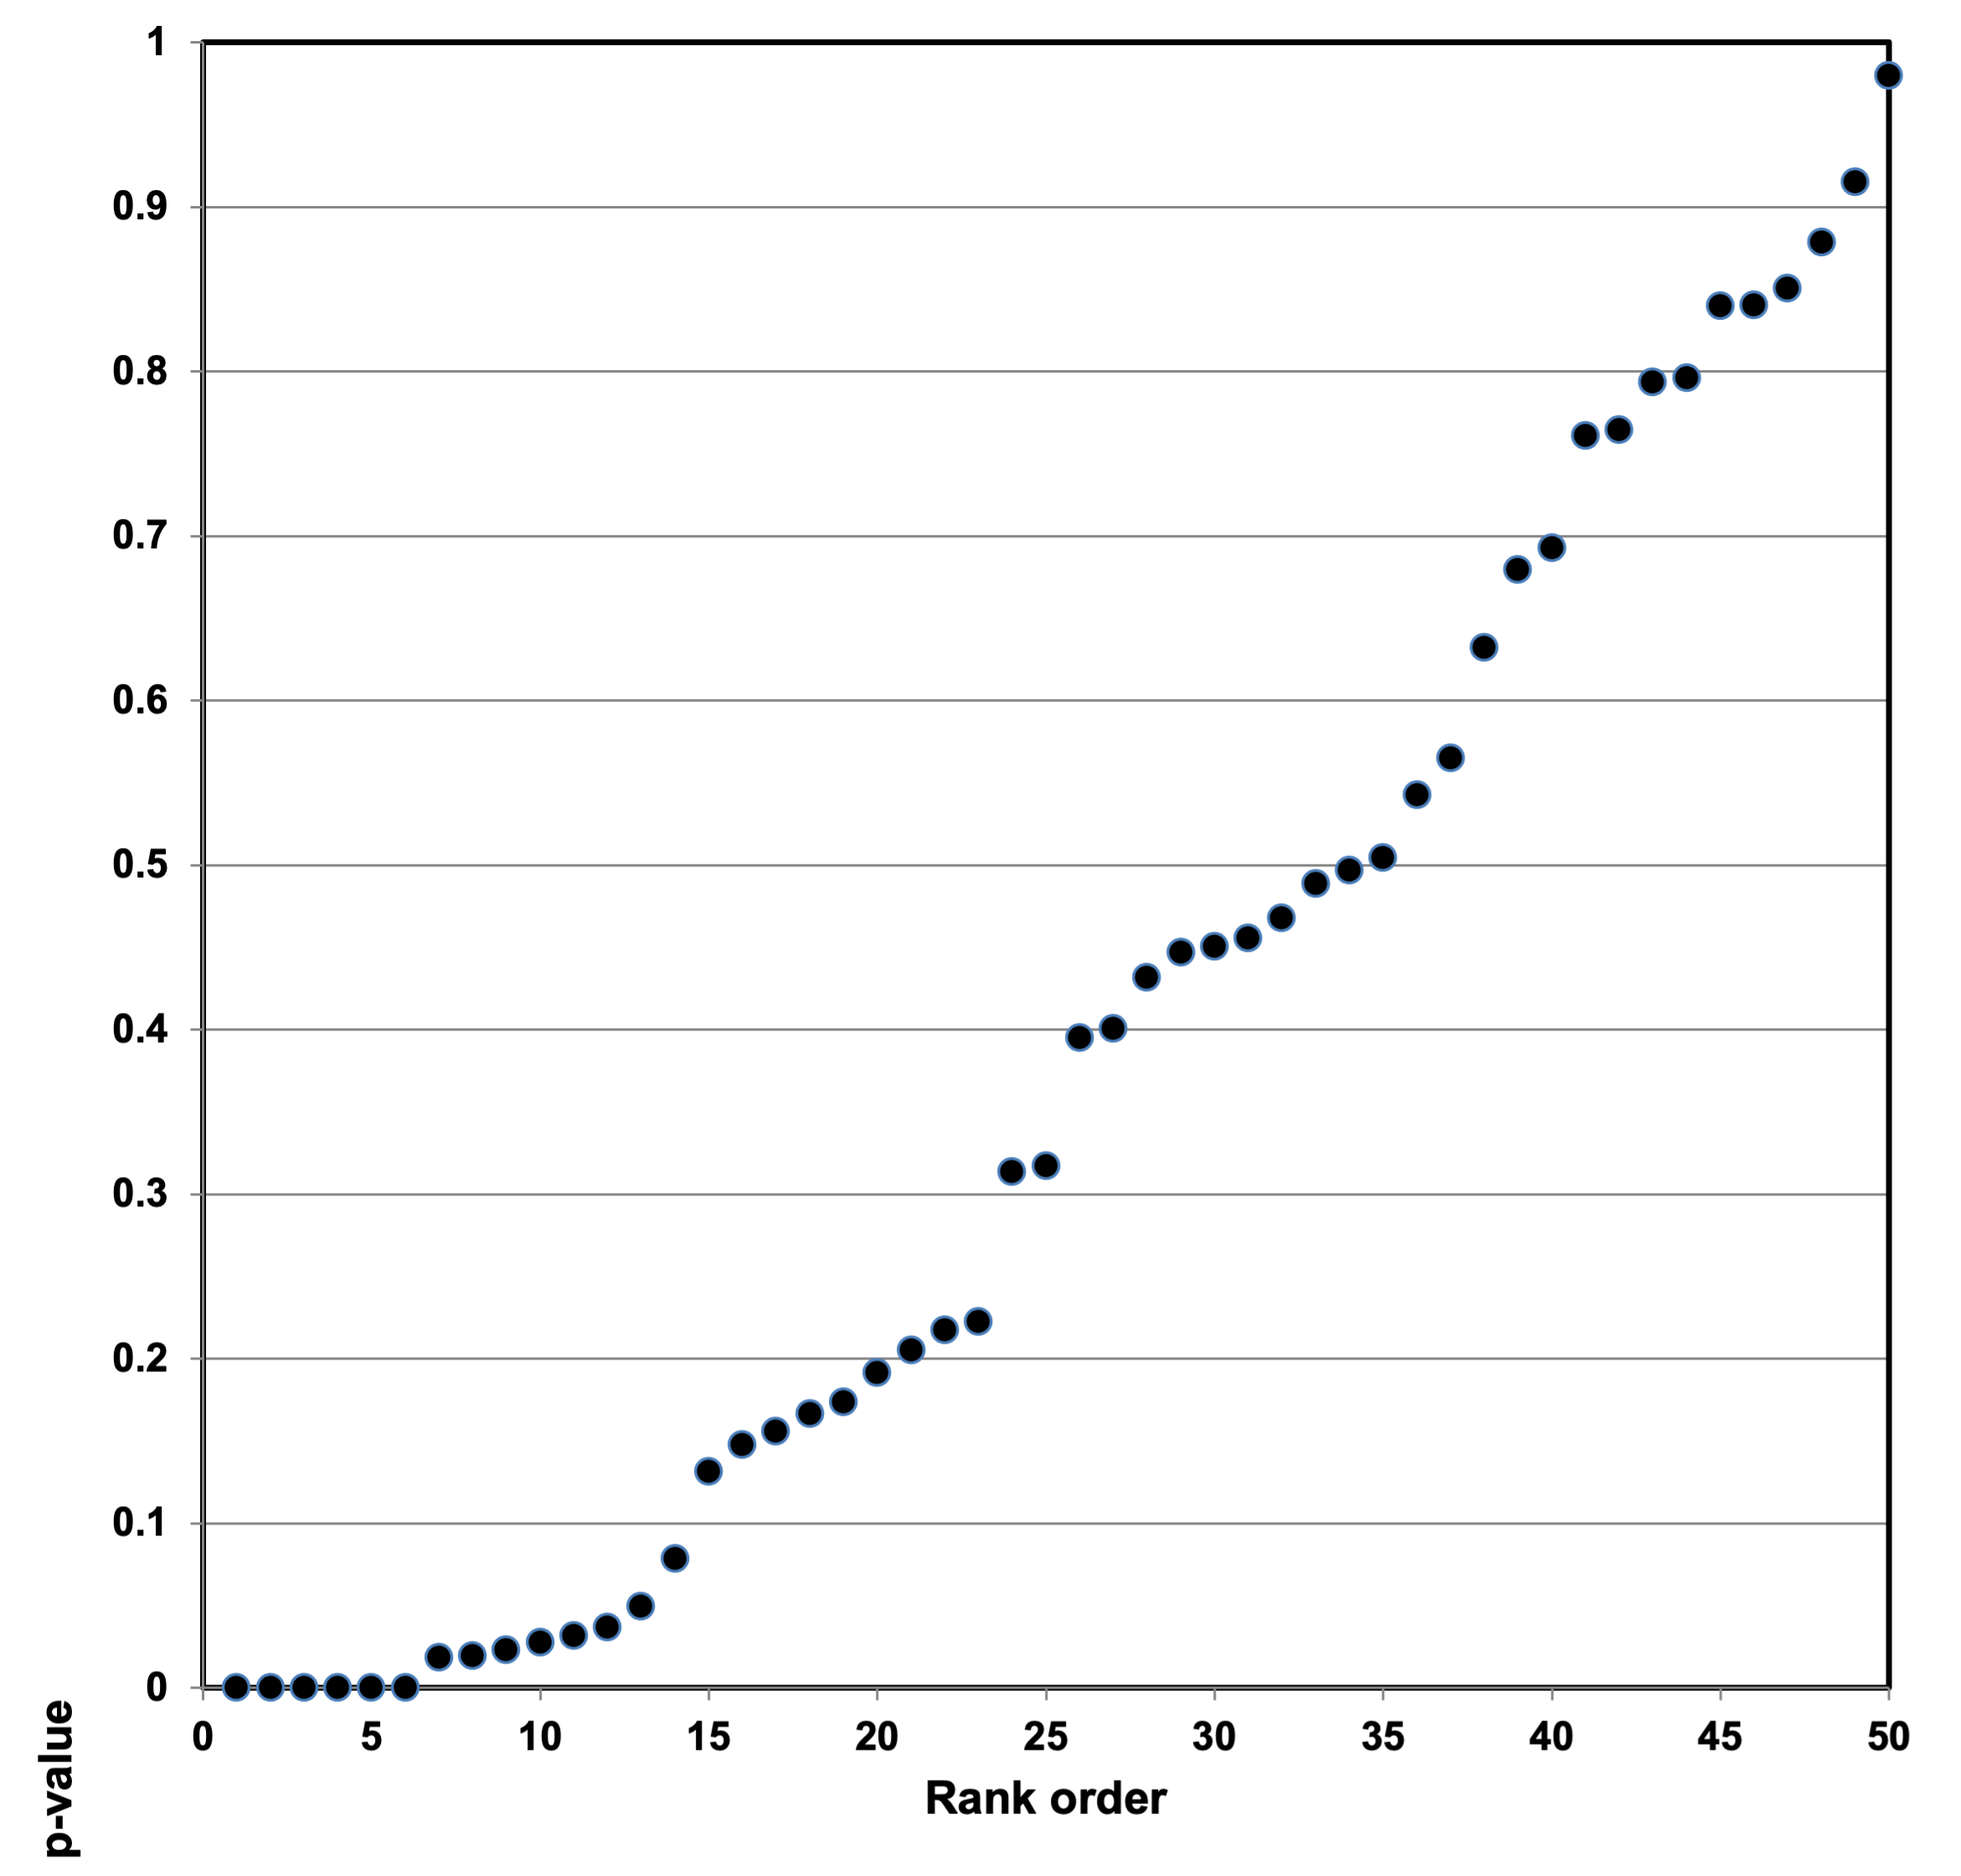
Figure 12: P-value plot for meta-analysis of the association between soy protein intake and LDL cholesterol reduction from Blanco Mejia et al.
The p-value plot is clearly bilinear and hence ambiguous. Most of the p-values are on a roughly 45-degree line.
Conclusions
Red and Processed Meats: Evidence of P-Hacking or Research Integrity Violations
Most nutritional epidemiologists now believe that red and processed meat are associated with severe health effects.160 The International Agency for Research on Cancer (IARC), the cancer research agency of the World Health Organization, has classified red meat as probably carcinogenic to humans and processed meat as certainly carcinogenic to humans.161
This consensus is brittle. Other researchers have challenged the nutritional epidemiologists’ consensus on other grounds. For example, as described below, Vernooij et al. argue the base observational studies are unreliable.162 The popular press, rather than deferring to a professional consensus, also has pushed back against this paradigm—not least by citing popular low-carbohydrate and high-meat diets (Atkins, etc.) that do not seem to have imposed ill effects on their practitioners.163 The nutritional epidemiologists’ consensus on the carcinogenic effects of red and processed meats does not possess full authority with either professionals or the public.
The Johnston research group (Vernooij et al.) has provided some of the strongest arguments to date against the nutritional epidemiologists’ consensus. Their large-scale systematic review and meta-analysis of the 105 base study papers studying the health effects of red and processed meats has provided strong evidence that the base study papers, generally observational studies, provided low- or very-low-certainty evidence164 according to GRADE criteria.165 Many nutritional epidemiologists reacted to their research extremely negatively. Some asked the editor of Annals of Internal Medicine, which accepted their study, to withdraw the paper before publication.166
Here we present further evidence, arrived at by a different line of critique, that the studies that claim severe health effects for red and processed meats are unreliable. The Johnston research group provided strong evidence that these studies relied on very weak proof; our study provides strong evidence that these studies, properly examined statistically (counting and p-value plots) for false positives and possible research integrity violations, provide no evidence at all that the claim is valid.
We believe that our critique applies more broadly to virtually every health claim based on FFQ data—indeed, that it applies to every nutrition study. Peace already has noted that FFQ research almost always reports the smallest or near-smallest p-value of many that were or could be computed.167 Nutritional epidemiology’s reliance on FFQ research has spread endemic selection bias, facilitated by uncorrected multiple testing, throughout the discipline.
Nutritional epidemiologists’ failure to correct for multiple testing registers epidemiologists’ larger failing. Stroup et al., for example, provided a proposal for reporting meta-analysis of observational studies in epidemiology.168 This proposal is frequently referred to in published literature—16,676 Google Scholar citations as of November 5, 2021.169 Yet Stroup et al. make no mention of observational studies’ MTMM problem and offer no recommendation to control for MTMM. We observe that epidemiologists are usually silent about MTMM, but when they do address the subject, they often are adamant that no correction for MTMM is necessary.170 We are not aware of any epidemiological article, institutional statement, or government regulation that has prescribed a MTMM correction for observational studies or directed meta-analysis researchers to account for MTMM bias.
To our knowledge, we are not aware of any epidemiological article, institutional statement, or government regulation that has prescribed a MTMM correction for observational studies or directed meta-analysis researchers to account for MTMM bias.
Meta-analyses provide greater evidentiary value if and only if they combine results from base studies that all use reliable data and analysis procedures.171 Base studies that do not correct for MTMM do not provide reliable data for meta-analyses. Furthermore, meta-analyses that combine base studies some of which do and others that do not correct for MTMM are not combining comparable studies. Either flaw suffices to render useless any meta-analysis that relies on even a single base study that fails to correct for MTMM. Moreover, if some base studies use fabricated or falsified data, as discussed below, that adds further irredeemable flaws to the meta-analysis.
Our bilinear p-value plots in Figure 8 provide strong evidence that nutritional epidemiological meta-analyses have examined base studies that do not use comparable methods—some may have corrected for MTMM, but most have not.172 Alternately, the bilinear plots may register the existence of one or more powerful covariates correlated with the predictor variable in some of the studies—that, for example, cardiorespiratory fitness was confounded with dietary risk of mortality.173 The existence of an unrecognized covariate would also render nugatory the meta-analysis’ results. Again, fabricated or falsified data cannot be ruled out.
The exceedingly large analysis search spaces in the 15 randomly selected base study papers of Vernooij et al. (Figure 4and Figure 5) also make it plausible to believe that the small p-values among the base studies may be derived from p-hacking, which other researchers have shown is extraordinarily widespread.174 The large number of papers derived from these cohort studies strengthens the plausibility of this proposition (Figure 6 and Figure 7).
The phrase “p-hacking” implies culpable volition, and we possess no statistical test to distinguish negligence from deliberate act. Nor can we immediately detect more severe breaches of research integrity. (See below.) In any case, the base studies’ lack of correction for MTMM renders them unfit for meta-analysis.
Soy Protein: Evidence of Research Integrity Violations
The nine base study papers that we analyzed in detail from the Blanco Mejia et al. meta-analysis had much smaller search spaces than those we analyzed from Vernooij et al.—a median search space of 24, within a range from 18 to 448. (See Figure 11.) Blanco Mejia et al. studied randomized controlled trials rather than observational studies. This difference likely accounts for the smaller number of search spaces, as researchers who conduct RCTs usually pre-select a single outcome variable and a single treatment variable, and randomization typically leads to fewer covariates.
Our analysis of the soy protein intake‒LDL cholesterol reduction claim, however, parallels our analysis of the claim for health effects from red and processed meats. The p-value plot yielded a strong bilinear pattern—a collection of studies with p-values both greater than and less than 0.05. (See Figure 12.)
Here we must address the possibility of research integrity violations as an explanation for the small p-values. We think most false research conclusions arise inadvertently, produced by flaws in conventional methods used for the standard practice of scientific and epidemiologic research—especially by misapplication of statistical methods.175 Yet research integrity violations certainly exist and must not to be taken lightly.176
Tugwell classifies research integrity violations as:
- Data fabrication (e.g., use of data from an uncredited author or generation of completely artificial data);
- data falsification (e.g., editing or manipulation of authentic data to ‘‘support’’ a hypothesis);
- unethical conduct (e.g., failure to obtain institutional review board approval, failure to obtain patients' informed consent, forgery of secondary authors’ signatures on submission, other breaches of ethical guidelines); and
- error (e.g., duplicate publication, scientific mistake, journal error, unstated reasons for retraction).177
George notes that evidence in the published literature for clinical trials suggests that cases of the most serious types of research misconduct—data fabrication and falsification—are relatively rare, but that other types of questionable research practices are quite common.178 This view would lead one to believe that spectacular individual scientific rogues such as Yoshitaka Fujii (183 retracted papers), Yoshihiro Sato (60 retracted papers), Diederik Stapel (55 retracted papers), and Brian Wansink (13 retracted papers) are shameful but atypical, and not the visible portion of an iceberg of research integrity violations.179
Researchers such as Ian Roberts, Barbara K. Redman, and Esmee Bordewijk, however, contend that research integrity violations are substantially more common, facilitated by systematically lax oversight by journals and institutions—not least their failure to require researchers to provide their data sets.180 Their views have not yet been accepted by the scientific community as a whole—even though recent controversies about research pertaining to hydroxychloroquine and COVID underscore both the existence of research integrity violations and their effect on matters of great practical import.181 Funding agencies and editors, the controllers of the research process, appear not to believe that there are enough research integrity violations to require a systemic overhaul of their procedures.
The lack of MTMM control most likely provides a sufficient explanation for the bilinear pattern the 15 randomly selected base study papers of Vernooij et al. display. (Figure 8.)182 Yet we did not expect to see the same bilinear pattern appear in our analysis of a meta-analysis based on randomized controlled trials (RCTs). RCTs have a good reputation precisely because they pre-select for investigation a single outcome variable and a single treatment variable—a method that among other virtues substantially reduces both multiple testing and bias from likely modeling effects. Indeed, DerSimonian and Laird predicated their meta-analysis approach on these characteristics of high-quality RCTs.183
Nevertheless, our p-value plot of the randomly selected base studies in the Blanco Mejia et al. study also produced a bilinear pattern, even though they were RCTs (Figure 12). We discovered 13 p-values below 0.05 supporting an effect and 37 above, supporting no effect. One of these small p-values—0.02037—is for an ‘increase’ (instead of decrease) in LDL cholesterol. The usual attention to control of MTMM of RCTs as compared with observational studies renders it less likely than that such a bilinear pattern could have emerged from randomness or negligence.
Our methods and conclusions cannot by themselves prove individual or systematic research integrity violations. But we believe they provide enough circumstantial evidence of widespread research integrity violations in the scientific community to prompt our scientific institutions to take sweeping measures to reduce the number of future research integrity violations.
Most practically, institutions such as the U.S. Department of Health and Human Services’ Office of Research Integrity (ORI), and other oversight entities, should set up procedures that will systematically inhibit research integrity violations.184 We provide recommendations, below, which we believe will substantially improve oversight policy at scientific institutions.
General Conclusions
We draw two conclusions from our investigation of the Vernooij et al. observational-based red and processed meats meta-analysis:
- Our analysis, complementing and deepening that of the Johnston research group, reveals that the base study papers used in the red and processed meat meta-analysis provide no evidence at all for the claimed health effects.
- Our analysis more broadly calls into question all similar observational research and meta-analyses drawing on FFQs and cohort studies that have not corrected for MTMM—which is, unfortunately, a very large proportion of nutritional epidemiology.
We draw the following conclusion from our investigation of the Blanco Mejia et al. RCT-based meta-analysis:
- Our analysis supports the FDA’s preliminary decision to revoke the 1999 health claim that links soy protein to heart health.
- Our analysis suggests that institutions, especially government agencies that evaluate scientific information as the basis for regulatory policy, should establish rigorous procedures to inhibit research integrity violations.
From our analysis of both meta-analysis studies, we agree with Redman that self-regulation, peer review, and editorial review, is not working well enough to support meta-analysis.185
Recommendations to the FDA
All nutritional epidemiologists—all scientists—should improve their methodologies to address the irreproducibility crisis. Yet to address scientists is to address a diffuse audience—and an audience that has so far proved resistant to many suggestions that they reform their practices. We therefore address our recommendations particularly, if not exclusively, to the FDA.
We do this partly because the FDA ought to address the frailties of nutritional epidemiology, which our analysis has highlighted, so as to improve the science that informs its regulations. We do this partly because the FDA, like federal regulatory agencies in general, possesses unmatched power, by dint of the regulatory and financial resources at its disposal, to improve scientific practices among scientists in general. We do this partly because the FDA is well-positioned to model reform for its peer regulators.
All these recommendations are intended to bring FDA methodologies up to the level of best available science, as per the mandate of The Information Quality Act.186 Best Available Science now means scientific procedures that systematically address the challenges of the irreproducibility crisis.
We make the following recommendations:
- The FDA should adopt controls for Multiple Testing and Multiple Modeling as part of its standard battery of tests applied to nutritional epidemiology research.
We have critiqued at length the standard procedure of nutritional epidemiology meta-analysis, which has proven susceptible to statistical frailties. The corollary of this critique is that the FDA should adopt the standard procedure, elaborated in a work partly written by one of our co-authors more than a quarter century ago,187 to control for nutritional epidemiology’s Multiple Testing and Multiple Modeling (MTMM) problem both in observational research and in RCTs.
This resampling-based multiple testing procedure already has been incorporated into a variety of disciplines, including genomics188 and economics,189 and has been shown to be optimal for a broad class of hypothesis testing problems.190 Any discipline using statistics can incorporate these procedures into their regular tests. Any government agency that relies on scientific research can require the use of such procedures to test scientific research, before it is used to justify regulation, or qualify as best available science. The FDA should do so.
The FDA, in other words, should only rely on base studies and meta-analyses that use a resampling methodology (MTMM) to correct their results. The FDA should also subject all such research to independent MTMM analyses.
MTMM analysis is not the only tool that can be used to adjust an analysis for p-hacking and other forms of biased sampling. But we believe it is a useful tool, which can easily be adopted by regulators and researchers to apply a severe test to scientific research.191 We do not propose it as a cure-all, but as a tool useful in itself, and also as an example of how to introduce reproducibility reforms into the ordinary procedures of professional and governmental judgments of scientific validity.
- The FDA should take greater cognizance of the difficulties associated with subgroup analysis.
Groups and individuals vary sufficiently in their responses to the same substances that it is conceivable that the FDA should not be attempting to give general nutrition advice to the public. Nutritional scientists and regulators therefore rightly aim to consider whether particular substances have different effects on different subgroups, defined by categories such as race and sex. Yet subgroup analysis multiplies the number of statistical operations and therefore multiplies the possibility of producing false positives. FDA policy for MTMM correction should include explicit and detailed consideration of how to apply it to subgroup analysis.192
- The FDA should require all studies that do not correct for MTMM to be labeled “exploratory.”
Research that does not correct for MTMM is exploratory rather than confirmatory and should be labeled clearly as such. The FDA should follow up on this reform either by ruling that its regulatory decisions cannot rely on exploratory research or, as a second best, by requiring regulators to explain in detail why they include exploratory research in their weight-of-evidence assessments.
- For nutritional health claims, the FDA should rely exclusively on meta-analyses that use tests to take account of endemic HARKing, p-hacking and other questionable research procedures.
HARKing, p-hacking, and other questionable research procedures are endemic in nutritional epidemiology—as they are in many disciplines affected by the irreproducibility crisis. Since so many base studies are unreliable, the meta-analyses which collate these base studies likewise have become unreliable.193
When the FDA uses meta-analyses or a systematic review to approve nutritional health claims, it should only rely on meta-analyses that conduct rigorous tests to detect whether a field’s base studies have been affected by HARKing, p-hacking, and other questionable research procedures. While we will not prescribe further particular methods here, we state that existing tests are not sufficient.194 The FDA should adopt tests substantially more stringent than those they currently accept.
- In approving nutritional health claims, the FDA should redo its assessment of base studies more broadly to take account of endemic HARKing, p-hacking and other questionable research procedures.
The different aspects of the irreproducibility crisis—HARKing, p-hacking, and other questionable research procedures—thrive opportunistically within research structures that allow scientists to conceal their questions and their data. Requiring research transparency will reduce the chance that the irreproducibility crisis will affect FDA approval of nutritional health claims. FDA can best proceed by requiring preregistration of research and public access to research data.
- The FDA should require preregistration and registered reports of all research that informs FDA approval of nutritional health claims.
Swaen et al. have noted that, “The strongest factor associated with the false positive or true positive study outcome was if the study had a specific a priori hypothesis. Fishing expeditions had an over threefold odds ratio of being false positive.”195 Preregistration and registered reports, using the procedures and resources of organizations such as the Center for Open Science (https://www.cos.io), will constrain the ability of scientists to HARK, inhibit p-hacking, and generally limit other questionable research procedures. Preregistration and registered reports are not cures. Determined scientists in time undoubtedly will devise methods to undermine the effectiveness of these precautions. But preregistration and registered reports will substantially improve the reliability of research used by the FDA. The FDA should stipulate that all preregistration and registered reports must detail the MTMM methods that will be used to assess results.
- The FDA should also require public access to all research data used to approve nutritional health claims.
Generally, any supplicant should provide the FDA with their analysis data set. Scientists often claim that analysis data sets cannot be made public because they must prevent the disclosure of the identity of human subjects. This claim is not persuasive, since we now possess standard methods such as micro-aggregation that can prevent such disclosures.196 Scientists should be expected to use such procedures as standard practices. The FDA should only use research papers that provide publicly accessible research data to inform regulatory decisions. Researchers should also be required to inform the FDA about every other piece of published research that has been based on the same analysis data set, to allow for proper MTMM assessment.
- The FDA should place greater weight on reproduced research.
We have specified the use of improved statistical techniques to reduce the effects of the irreproducibility crisis in nutritional epidemiology. But such statistical tests cannot catch every sort of questionable research procedure. Indeed, research that passes every statistical test might still be a false positive. The FDA therefore should increase the weight it assigns to research that is not only reproducible, but that has also been reproduced—and decrease the weight it assigns to research that has not yet been reproduced.
Indeed, Richard Smith—a former editor of BMJ—recently blogged there is substantial evidence of research integrity violations with small, randomized medical studies.197 We note that standard meta-analysis computations are not robust if they contain even one such study.
- The FDA should consider the more radical reform of funding data set building and data set analysis separately.
Researchers who combine data collection and data analysis possess a temptation to adjust the data to improve results of their analyses. The FDA should consider separating these two functions, so as to remove the situation that presents this temptation. It should also consider combining this reform with a requirement that researchers provide a held-out data set to a trusted third party before analysis, so that any analysis claim can be tested independently using the held-out data set.198
10. The FDA should exercise care in the use of the “weight of evidence” standard to assess both base studies and meta-analyses, to take account of the irreproducibility crisis.
The “weight of evidence” principle generally facilitates arbitrary judgments as to what science should inform government policy or regulation. Wherever possible, the FDA should substitute transparent rules for “weight of evidence” judgments, in particular the rules for accepting or rejecting papers to be used in a meta-analysis. If the FDA conducts a meta-analysis, it should provide clear rules for accepting/rejecting the base study papers used.
- The FDA should not fund or rely on research of other organizations until these organizations adopt sound statistical practices. The FDA should not fund external organizations, such as the World Health Organization (WHO) and the International Agency for Research on Cancer (IARC), until they adopt sound statistical practices. Neither should it rely on their research to inform its regulatory decisions.
- The FDA should establish systematic procedures to inhibit research integrity violations.
The FDA, as well as other federal departments and regulatory agencies that share responsibility for funding and assessing nutritional research,199 should establish systematic procedures to inhibit research integrity violations. We may phrase this positively as a call for the FDA to mandate a system of Good Institutional Practices (GIP) for all recipients of FDA money, and for all research that informs FDA regulatory decisions.200 GIP should include practices such as:
- annual training for principal investigators and students in applying research ethics to data analysis (e.g., lessons to avoid bad practices such as p-hacking and HARKING);
- random audits of laboratory note books;
- whistleblower systems for research integrity violations;
- real consequences for delinquent researchers, including bars on grant applications, lost lab space, and bars on accepting new members into their research groups;
- annual reporting requirements by institutions receiving FDA funds;
- real consequences for institutions that fail to enforce GIP in their institutions, including institutional loss of eligibility for government funding; and
- established procedures within the FDA to ensure compliance with GIP guidelines.
Scope and Implementation
We believe the FDA should not overturn previously approved nutritional health claims arbitrarily as it implements our recommendations. Regulatory stability is an important goal for the Federal government, and indeed for any system of laws and regulations. American enterprises have invested substantial resources in nutritional research, and their investments should not casually be set at naught.201
Yet nutritional health claims can amount to a competitive advantage to large corporations against small ones, since large companies have greater capacity to fund research that favors their products. While regulatory stability must be one important goal for the Federal government, it should not be used to provide an enduring competitive advantage to big business—and particularly not an advantage predicated upon publicizing health claims that are, all too frequently, both misleading and poorly substantiated. Furthermore, the costs of false health claims are borne ultimately by American consumers—American citizens.
When new data, new analysis methods, and new theory call into question and overturn previously established science, the nutritional health claims that the now-discredited science once justified should be dismantled—if not in haste, then with all deliberate speed. We should not grandfather bad nutritional science forever—or even for very long.
Final Considerations
We have used the phrase “irreproducibility crisis” in this report. Many scientists agree that there are serious problems with nutritional research, for which the term “crisis” seems an appropriate descriptor.202 Other distinguished meta-researchers, however, prefer to regard the current situation as an “irreproducibility challenge.”203 We do believe that HARKing, p-hacking, and other questionable research procedures, including research integrity violations, are endemic within science, and particularly within nutritional epidemiology. We also recognize that not every reader will acknowledge that such a crisis exists.
For readers who regard the current situation as an irreproducibility challenge, we say that you do not need to believe there is an irreproducibility crisis. You can believe that it is better to regard these problems as irreproducibility challenges. Whether challenge or crisis, these scientific practices are not the best available science. We should use the best scientific practices simply because they are the best scientific practices. Mediocrity ought not be acceptable.
This applies doubly to the science that underpins government (FDA) approval of nutritional health claims. Statisticalresearch that seeks out associations must justify itself against the null hypothesis. Likewise, nutritional health claims must justify themselves against the null hypothesis of citizen free choice—that it is better for government to do nothing and for the republic’s citizens to exercise their freedoms untrammeled. Research used to justify government approval of nutritional health claims, even more than ordinary research, should survive every severe test available before it is taken as credible.
This has long been the spirit of American regulatory policy. Our policymakers, representing the American people, long ago decided that regulations must justify themselves with the best available science—that is, science that has passed the severest tests. They used this phrase to defend the welfare of the American people, not to facilitate the abrogation of its liberties; best available science should restrict government bureaucrats from exercising arbitrary power.
Best available science should restrict government bureaucrats from exercising arbitrary power.
We have subjected to serious scrutiny the science underpinning nutritional health claims in relation to red and processed meat and soy protein. We believe the FDA should take account of our methods as it considers particular health claims. Yet we care even more about reforming the procedures the FDA uses in general to assess nutritional science.
Government regulatory procedure matters far more than any particular implementation of regulatory policy. Validationprocedures for statistical data matter the most of all, regardless of how they affect government policy—for science cannot reliably seek out truth on a foundation of rotten procedure.204 This report focuses on FDA regulatory policy, but we must never lose sight of that loftier goal.
The government should use the very best science—whatever the regulatory consequences. Scientists should use the very best research procedures—whatever results they find. Those principles are the twin keynotes of this report. The very best science and research procedures involve building evidence on the solid rock of transparent, reproducible, and reproduced scientific inquiry, not on shifting sands.
Appendix 1: Multiple Testing and Multiple Modeling (MTMM) and Epidemiology
Multiple Testing and Multiple Modeling (MTMM) controls for experiment-wise error—the probability that at least one individual claim will register a false positive when you conduct multiple statistical tests.205 It is instructive to trace some of the history with examples of MTMM with respect to epidemiology.
Friedman made a research claim in 1959 that Type A personality was associated with heart attacks.206 Several later studies failed to replicate these results. Expert committees found fault with these latter studies and the Type Apersonality-heart attack claim lives to this day. Yet Friedman’s initial study examined hundreds of distinct analytical questions. It is very likely that the association is nothing more than a multiple-testing false positive.207
In 1974, a Lancet paper noted an association of the popular blood-pressure drug reserpine and breast cancer, with a p-value < 0.01.208 Several later studies failed to replicate these results.209 Sam Shapiro, a co-author of the original Lancet paper, later explained that,
Slone and I came to realize that our initial hypothesis-generating study was sloppily designed and inadequately performed. In addition, we had carried out, quite literally, thousands of comparisons involving hundreds of outcomes and hundreds (if not thousands) of exposures. As a matter of probability theory, ‘statistically significant’ associations were bound to pop up and what we had described as a possibly causal association was really a chance finding.210
Yale epidemiologist Alvan Feinstein provided the first rigorous insight into epidemiology’s multiple testing (MTMM) problem in two 1988 papers. Feinstein’s first paper counted published studies for and against 56 different research claims and found that there were roughly an equal number of studies supporting each particular claim as there were studies rejecting the claim.211
Feinstein’s second paper argued that a close analysis of these studies revealed that the researchers did not begin their research with a defined, single question. Instead, they allowed the data to define the question and then published the results.212 An enormous proportion of epidemiology research conclusions were the result of multiple testing and (in modern nomenclature) HARKing, hypothesizing after the result was known.
Statisticians have long been aware of the pitfalls of multiple testing: practitioners are keenly aware that error probabilities are not maintained when there is multiple testing of the same set of data.213 In the 1970s and 1980s, statisticians produced considerable literature on applied medical work that examined associations of blood types with disease.214
In 1985, Westfall observed that the relevant research produced multiple confidence intervals, and that these intervals could be made just wide enough to provide a proper correction parameter for the body of multiple tests by the use of resampling techniques that preserved the overall family-wise error rate. This assesses the chance of producing a false positive result while making multiple statistical tests. In other words, researchers who used resampling techniques now had a practical way to assess the probability that multiple testing had produced false positive results.215 Simulation could solve the otherwise intractable multiple testing problem.
Epidemiologists, unfortunately, instead decided as a body to disregard the multiple-testing challenge identified by Feinstein. In 1990, the lead editorial in the very first issue of the new journal Epidemiology explicitly articulated this disregard in its title: “No Adjustments Are Needed for Multiple Comparisons.”216 The discipline, alas, generally has followed this counsel.
A book offering practical solutions to the multiple testing problem has been available since 1993217 and it has been cited more than 3500 times since;218 but very rarely is it used or cited in the major epidemiology journals.219 In 2000, Clyde did recognize that environmental epidemiology needed to account for multiple modeling and proposed a Bayesian model average as a solution.220 The field also has paid limited attention to this alternate solution. Clyde (2000) has only been cited twice in the leading environmental epidemiology journal Environmental Health Perspectives.221
Hayat et al. recently analyzed 216 randomly selected articles from a total of 1,023 published in 2013 at seven influential public health journals (American Journal of Public Health, American Journal of Preventive Medicine,International Journal of Epidemiology, European Journal of Epidemiology, Epidemiology, American Journal of Epidemiology, and Bulletin of the World Health Organization). Only 5.1% of the 216 studies they reviewed reported making statistical corrections for multiple testing.222 We speculate that the studies that performed these corrections were in the genetic epidemiology subdiscipline. As a whole, epidemiologists have not subjected their research to the severe test of Multiple Testing and Multiple Modeling. Their unwillingness to subject their research to this easy and basic test warrants significant skepticism of all the field’s results.
Appendix 2: Statistical Significance
What is Statistical Significance?
The requirement that a research result be statistically significant has long been a convention of epidemiologic research.223 In hundreds of journals, in a wide variety of disciplines, you are much more likely to get published if you claim to have a statistically significant result. To understand the nature of the irreproducibility crisis, we must examine the nature of statistical significance. Researchers try to determine whether the relationships they study differ from what can be explained by chance alone by gathering data and applying hypothesis tests, also called tests of statistical significance.
In practice, the hypothesis that forms the basis of a test of statistical significance is rarely the researcher’s original hypothesis that a relationship between two variables exists. Instead, scientists almost always test the hypothesis that norelationship exists between the relevant variables. Statisticians call this the null hypothesis. As a basis for statistical tests, the null hypothesis is mathematically precise in a way that the original hypothesis typically is not. A test of statistical significance yields a mathematical estimate of how well the data collected by the researcher supports the null hypothesis. This estimate is called a p-value.
It is traditional in the epidemiological disciplines to use confidence intervals instead of p-values from a hypothesis test to demonstrate statistical significance. As both confidence intervals and p-values are constructed from the same data, they are interchangeable, and one can be estimated from the other.224 Our use of p-values in this report implies they can be (and are) estimated from the confidence intervals used in environmental epidemiology studies.
|
The Bell Curve and the P-Value: The Mathematical Background All “classical” statistical methods rely on the Central Limit Theorem, proved by Pierre-Simon Laplace in 1810. The theorem states that if a series of random trials are conducted, and if the results of the trials are independent and identically distributed, the resulting normalized distribution of actual results, when compared to the average, will approach an idealized bell-shaped curve as the number of trials increases without limit. By the early twentieth century, as the industrial landscape came to be dominated by methods of mass production, the theorem found application in methods of industrial quality control. Specifically, the p-test naturally arose in connection with the question “how likely is it that a manufactured part will depart so much from specifications that it won’t fit well enough to be used in the final assemblage of parts?” The p-test, and similar statistics, became standard components of industrial quality control. It is noteworthy that during the first century or so after the Central Limit Theorem had been proved by Laplace, its application was restricted to actual physical measurements of inanimate objects. While philosophical grounds for questioning the assumption of independent and identically distributed errors existed (i.e., we can never know for certain that two random variables are identically distributed), the assumption seemed plausible enough when discussing measurements of length, or temperatures, or barometric pressures. Later in the twentieth century, to make their fields of inquiry appear more “scientific”, the Central Limit Theorem began to be applied to human data, even though nobody can possibly believe that any two human beings—the things now being measured—are truly independent and identical. The entire statistical basis of “observational social science” rests on shaky supports, because it assumes the truth of a theorem that cannot be proved applicable to the observations that social scientists make. |
A p-value estimated from a confidence interval is a number between zero and one, representing a probability based on the assumption that the null hypothesis is actually true.225 A very low p-value means that, if the null hypothesis is true, the researcher’s data are rather extreme—surprising, because a researcher’s formal thesis when conducting a null hypothesis test is that there is no association or difference between two groups. It should be rare for data to be so incompatible with the null hypothesis. But perhaps the null hypothesis is not true, in which case the researcher’s data would not be so surprising. If nothing is wrong with the researcher’s procedures for data collection and analysis, then the smaller the p-value, the less likely it is that the null hypothesis is correct.
In other words: the smaller the p-value, the more reasonable it is to reject the null hypothesis and conclude that the relationship originally hypothesized by the researcher does exist between the variables in question. Conversely, the higher the p-value, and the more typical the researcher’s data would be in a world where the null hypothesis is true, the less reasonable it is to reject the null hypothesis. Thus, the p-value provides a rough measure of the validity of the null hypothesis—and, by extension, of the researcher’s “real hypothesis” as well.226 Or it would, if a statistically significant p-value had not become the gold standard for scientific publication.227
Why Does Statistical Significance Matter?
The government’s central role in science, both in funding scientific research and in using scientific research to justify regulation, further disseminated statistical significance throughout the academic world. Within a generation, statistical significance went from a useful shorthand that agricultural and industrial researchers used to judge whether to continue their current line of work, or switch to something new, to a prerequisite for regulation, government grants, tenure, and every other form of scientific prestige—and also, and crucially, the essential prerequisite for professional publication.
Scientists’ incentive to produce positive, original results became an incentive to produce statistically significant results. Groupthink, frequently enforced via peer review and editorial selection, inhibits publication of results that run counter to disciplinary or political presuppositions.228 Many more scientists use a variety of statistical practices, with more or less culpable carelessness, including:
● improper statistical methodology;
● consciously or unconsciously biased data manipulation that produces desired outcomes;
● choosing between multiple measures of a variable, selecting those that provide statistically significant results, and ignoring those that do not; and
● using illegitimate manipulations of research techniques.229
Still others run statistical analyses until they find a statistically significant result—and publish the one (likely spurious) result. Far too many researchers report their methods unclearly, and let the uninformed reader assume they actually followed a rigorous scientific procedure.230 A remarkably large number of researchers admit informally to one or more of these practices—which collectively are informally called p-hacking.231 Significant evidence suggests that p-hacking is pervasive in an extraordinary number of scientific disciplines.232 HARKing is the most insidious form of p-hacking.
Appendix 3: The Irreproducibility Crisis of Modern Science
The Catastrophic Failure of Scientific Replication
Let us briefly review the methods and procedures of science. The empirical scientist conducts controlled experiments and keeps accurate, unbiased records of all observable conditions at the time the experiment is conducted. If a researcher has discovered a genuinely new or previously unobserved natural phenomenon, other researchers—with access to his notes and some apparatus of their own devising—will be able to reproduce or confirm the discovery. If sufficient corroboration is forthcoming, the scientific community eventually acknowledges that the phenomenon is real and adapts existing theory to accommodate the new observations.
The validation of scientific truth requires replication or reproduction. Replicability (most applicable to the laboratory sciences) most commonly refers to obtaining an experiment’s results in an independent study, by a different investigator with different data, while reproducibility (most applicable to the observational sciences) refers to different investigators using the same data, methods, and/or computer code to reach the same conclusion.233 We may further subdivide reproducibility into methods reproducibility, results reproducibility, and inferential reproducibility.234 Scientific knowledge only accrues as multiple independent investigators replicate and reproduce one another’s work.235
Yet today the scientific process of replication and reproduction has ceased to function properly. A vast proportion of the scientific claims in published literature have not been replicated or reproduced; credible estimates are that a majority of these claims cannot be replicated or reproduced—that they are in fact false.236 An extraordinary number of scientific and social-scientific disciplines no longer reliably produce true results—a state of affairs commonly referred to as the irreproducibility crisis (reproducibility crisis, replication crisis). A substantial majority of 1,500 active scientists recently surveyed by Nature called the current situation a crisis; 52% judged the situation a major crisis and another 38% judged it “only” a minor crisis.237 The increasingly degraded ordinary procedures of modern science display the symptoms of catastrophic failure.238
The scientific world’s dysfunctional professional incentives bear much of the blame for this catastrophic failure.
The Scientific World’s Professional Incentives
Scientists generally think of themselves as pure truth-seekers who seek to follow a scientific ethos roughly corresponding to Merton’s norms of universalism, communality, disinterestedness, and organized skepticism.239 Public trust in scientists240 generally derives from a belief that they adhere successfully to those norms. But this self-conception differs markedly from reality.
Knowingly or unknowingly, scientists respond to economic and reputational incentives as they pursue their own self-interest.241 Buchanan and Tullock’s work on public choice theory provides a good general framework. Politicians and civil servants (bureaucrats) act to maximize their self-interest rather than acting as disinterested servants of the public good.242 This general insight applies specifically to scientists, peer reviewers, and government experts.243 The different participants in the scientific research system all serve their own interests as they follow the system’s incentives.
Well-published university researchers earn tenure, promotion, lateral moves to more prestigious universities, salary increases, grants, professional reputation, and public esteem—above all, from publishing exciting, new, positive results. The same incentives affect journal editors, who receive acclaim for their journal, and personal reputational awards, by publishing exciting new research—even if the research has not been vetted thoroughly.244 Grantors want to fund the same sort of exciting research—and government funders possess the added incentive that exciting research with positive results also supports the expansion of their organizational mission.245 American university administrations want to host grant-winning research, from which they profit by receiving “overhead” costs—frequently a majority of overall research grant costs.246
All these incentives reward published research with new positive claims—but not reproducible research. Researchers, editors, grantors, bureaucrats, university administrations—each has an incentive to seek out the exciting new research that draws money, status, and power, but few or no incentives to double check their work. Above all, they have little incentive to reproduce the research, to check that the exciting claim holds up—because if it does not, they will lose money, status, and prestige.
Each member of the scientific research system, seeking to serve his or her own interest, engages in procedures guaranteed to inflate the production of exciting, but false research claims in peer-reviewed publications. Collectively, the scientific world’s professional incentives do not sufficiently reward reproducible research. We can measure the overall effect of the scientific world’s professional incentives by analyzing publication bias.
|
Academic Incentives versus Industrial Incentives Far too many academics and bureaucrats, and a distressingly large amount of the public, believe that university science is superior to industrial science. University science is believed to be disinterested; industrial science corrupted by the desire to make a profit. University science is believed to be accurate and reliable; industrial science is not.247 Our critique of the scientific world’s professional incentives is, above all, a critique of university science incentives. According to one study, zero out of fifty-two epidemiological claims in randomized trials could be replicated.248 According to another, only 36 of 100 of the most important psychology studies could be replicated.249 Nutritional research, a tissue of disproven claims such as coffee causes pancreatic cancer, has lost much of its public credibility.250 Academic science, both observational and experimental, possesses astonishingly high error rates—and peer and editorial review of university research no longer provides effective quality control.251 Industry research is subject to far more effective quality control. Government-imposed Good Laboratory Practice Standards, and their equivalents, apply to a broad range of industry research—and do not apply to university research.252 Industry, moreover, is subject to the most effective quality control of all—a company’s products must work, or it will go out of business.253 Both the profit incentive and government regulation tend to make industrial science reliable; neither operates upon academic science. As we will see below, environmental epidemiology regulation is largely based on university research. We should treat it with the same skepticism as we would industry research. |
Publication Bias: How Published Research Skews Toward False Positive Results
The scientific world’s incentives for exciting research rather than reproducible research drastically affects which research scientists submit for publication. Scientists who try to build their careers on checking old findings or publishing negative results are unlikely to achieve professional success. The result is that scientists simply do not submit negative results for publication. Some negative results go to the file drawer. Others somehow turn into positive results as researchers, consciously or unconsciously, massage their data and their analyses. Neither do they perform or publish many replication studies, since the scientific world’s incentives do not reward those activities either.254
We can measure this effect by anecdote. One co-author recently attended a conference where a young scientist stood up and said she spent six months trying unsuccessfully to replicate a literature claim. Her mentor said to move on—and that failed replication never entered the scientific literature. Individual papers also recount problems, such as difficulties encountered when correcting errors in peer-reviewed literature.255 We can quantify this skew by measuringpublication bias—the skew in published research toward positive results compared with results present in the unpublished literature.256
A body of scientific literature ought to have a large number of negative results, or results with mixed and inconclusive results. When we examine a given body of literature and find an overwhelmingly large number of positive results, especially when we check it against the unpublished literature and find a larger number of negative results, we have evidence that the discipline’s professional literature is skewed to magnify positive effects, or even create them out of whole cloth.257
As far back as 1987, a study of the medical literature on clinical trials showed a publication bias toward positive results: “Of the 178 completed unpublished randomized controlled trials (RCTs)258 with a trend specified, 26 (14%) favored the new therapy compared to 423 of 767 (55%) published reports.”259 Later studies provide further evidence that the phenomenon affects an extraordinarily wide range of fields, including:
- the social sciences generally, where “strong results are 40 percentage points more likely to be published than are null results and 60 percentage points more likely to be written up;”260
- climate science, where “a survey of Science and Nature demonstrates that the likelihood that recent literature is not biased in a positive or negative direction is less than one in 5.2 × 10^-16;”261
- psychology, where “the negative correlation between effect size and samples size, and the biased distribution of p values indicate pervasive publication bias in the entire field of psychology;”262
- sociology, where “the hypothesis of no publication bias can be rejected at approximately the 1 in 10 million level;”263
- research on drug education, where “publication bias was identified in relation to a series of drug education reviews which have been very influential on subsequent research, policy and practice;”264 and
- research on “mindfulness-based mental health interventions,” where “108 (87%) of 124 published trials reported ≥1 positive outcome in the abstract, and 109 (88%) concluded that mindfulness-based therapy was effective, 1.6 times greater than the expected number of positive trials based on effect size.”265
What publication bias especially leads to is a skew in favor of research that erroneously claims to have discovered a statistically significant relationship in its data.
Appendix 4: P-Value Plotting: A Severe Test for Publication Bias, P-hacking, and HARKing
Introduction
We use p-value plotting to test whether a field has been affected by the irreproducibility crisis—by publication bias, p-hacking, and HARKing. In essence, we analyze meta-analyses of research and output their results on a simple plot that displays the distribution of p-value results:
● A literature unaffected by publication bias, p-hacking or HARKing should display its results as a single line.
● A literature which has been affected by publication bias, p-hacking or HARKing should display bilinearity—results visible as two, separated lines.
P-value plotting of meta-analyses results allows a reader, at a glance, to determine whether there is circumstantial evidence that a body of scientific literature has been affected by the irreproducibility crisis.
We will summarize here the statistical components of p-value plotting. We will begin by outlining a few basic elements of statistical methodology: counting; the definition and nature of p-values; and a simple p-value plotting method, which makes it relatively simple to evaluate a collection of p-values. We will then explain what meta-analyses are, and how they are used to inform government regulation. We will then explain how precisely p-value plotting of meta-analyses works, and what it reveals about the scientific literature it tests.
Counting
Counting can be used to identify which research papers in literature may suffer from the various biases described above. We should want to know how many “questions” are under consideration in a research paper. In a typical nutritional epidemiology paper, for example, there are usually several health outcomes at issue, such as all-cause deaths, cardiovascular endpoints (e.g., heart attacks, stroke), diabetes, and various cancers (e.g., breast, colorectal, gallbladder, and liver). Researchers consider whether a risk factor, such as individual food frequencies, predicts any of these health outcomes—that is to say, whether they are “positively” associated with a particular health outcome. When they study foods, epidemiologists may analyze categories including individual food frequencies, food groups, nutrient indexes, and food-group-specific nutrient indexes.
Each of these risk factors is a predictor, each type of health effect is an outcome. Scientists may further analyze an association between a particular food component and a particular health outcome with reference to categories of analysis such as age and sex. Researchers call these further yes/no categories of analysis covariates; covariates may affect the strength of the association, but they are not the direct objects of study.
An epidemiology paper considers a number of questions equal to the product of the number of predictors (P) times the number of outcomes (O) times 2 to the power of the number of yes/no covariates (C). In other words:
the number of questions = P x O x 2^C
This formula approximates the number of statistical tests an epidemiology study performs. The larger the number of statistical tests, the easier it is to find a statistically significant association due solely to chance.
P-values
As we have summarized above, a null hypothesis significance test is a method of statistical inference in which a researcher tests a factor (or predictor) against a hypothesis of no association with an outcome. The researcher uses an appropriate statistical test to attempt to disprove the null hypothesis. The researcher then converts the result to a p-value. The p-value is a value between 0 and 1 and it is a numerical measure of significance. The smaller the p-value, the more significant the result. Significance is the technical term for surprise. When we are conducting a null hypothesis significance test, we should expect no relationship between any particular predictor and any particular outcome. Any association, any departure from the null hypothesis (random chance), should and does surprise us.
If the p-value is small—conventionally in many disciplines, less than 0.05—then the researcher may reject the null hypothesis and conclude the result is surprising and that there is indeed evidence for a significant relationship between a predictor and an outcome. If the p-value is large—conventionally, greater than 0.05—then the researcher should accept the null hypothesis and conclude there is nothing surprising and that there is no evidence for a significant relationship between a predictor and an outcome.
But strong evidence is not dispositive (absolute) evidence. By definition, where p = 0.05, a null hypothesis that is true will be rejected, by chance, 5% of the time. When this happens, it is called a false positive—false positive evidence for the research hypothesis (false evidence against the null hypothesis). The size of the experiment does not matter. When researchers compute a single p-value, both large and small studies have a 5% chance of producing a false positive result.
Such studies, by definition, can also produce false negatives—false negative evidence against the research hypothesis (false evidence for the null hypothesis). In a world of pure science, false positives and false negatives would have equally negative effects on published research. But all the incentives in our summary of the Irreproducibility Crisis indicate that scientists vastly overproduce false positive results. We will focus here, therefore, on false positives—which far outnumber false negatives in the published scientific literature.266
We will focus particularly on how and why conducting a large number of statistical tests produces many false positives by chance alone.
Simulating Random p-values
We can illustrate how a large number of statistical tests produce false positives by chance alone by means of a simulated experiment. We can use a computer to generate 100 pseudo-random numbers between 0 and 1 that mimic p-values and enter them into a 5 x 20 table. (See Figure 13.) These randomly generated p-values should be evenly distributed, with approximately 5 results between 0 and 0.05, 5 between 0.05 and 0.10, and so on—approximately, because a randomly generated sequence of numbers should not produce a perfectly uniform distribution.
In Figure 13, we have simulated a nutritional epidemiology study using a hypothetical single cohort data set analyzing associations between 5 individual foods and 20 health outcomes. Remember, these numbers were picked at random.
Figure 13: 100 Simulated p-values
|
Outcomes |
Food 1 |
Food 2 |
Food 3 |
Food 4 |
Food 5 |
|
O 01 |
0.899 |
0.417 |
0.673 |
0.754 |
0.686 |
|
O 02 |
0.299 |
0.349 |
0.944 |
0.405 |
0.878 |
|
O 03 |
0.868 |
0.535 |
0.448 |
0.430 |
0.221 |
|
O 04 |
0.439 |
0.897 |
0.930 |
0.500 |
0.257 |
|
O 05 |
0.429 |
0.082 |
0.038 |
0.478 |
0.053 |
|
O 06 |
0.432 |
0.305 |
0.056 |
0.403 |
0.821 |
|
O 07 |
0.982 |
0.707 |
0.460 |
0.789 |
0.956 |
|
O 08 |
0.723 |
0.931 |
0.827 |
0.296 |
0.758 |
|
O 09 |
0.174 |
0.982 |
0.277 |
0.970 |
0.366 |
|
O 10 |
0.117 |
0.339 |
0.281 |
0.746 |
0.419 |
|
O 11 |
0.433 |
0.640 |
0.313 |
0.310 |
0.482 |
|
O 12 |
0.004 |
0.412 |
0.428 |
0.195 |
0.184 |
|
O 13 |
0.663 |
0.552 |
0.893 |
0.084 |
0.827 |
|
O 14 |
0.785 |
0.398 |
0.895 |
0.393 |
0.092 |
|
O 15 |
0.595 |
0.322 |
0.159 |
0.407 |
0.663 |
|
O 16 |
0.553 |
0.173 |
0.452 |
0.859 |
0.899 |
|
O 17 |
0.748 |
0.480 |
0.486 |
0.018 |
0.130 |
|
O 18 |
0.643 |
0.371 |
0.303 |
0.614 |
0.149 |
|
O 19 |
0.878 |
0.548 |
0.039 |
0.864 |
0.152 |
|
O 20 |
0.559 |
0.343 |
0.187 |
0.109 |
0.930 |
Each box in Figure 13 represents a different statistical test applied to associate a predictor (a food component) with an outcome (a health consequence). The Figure displays results of 100 null hypothesis tests analyzing whether each of the five different food components are positively associated with 20 different outcomes. Each box represents one out of 100 null hypothesis statistical tests—1 test for each of 20 health outcomes, applied to 5 different food components. The number in the box represents the p-value of each individual statistical test.
This simulation contains four p-values that are less than 0.05: 0.004, 0.038, 0.039 and 0.018. In other words, by sheer chance alone, a researcher could write and publish four professional articles based on the four “significant” results (p-values less than 0.05). Researchers are supposed to take account of these pitfalls (chance outcomes). There are standard procedures that can be used to prevent researchers from simply cherry-picking “significant” results.267 But it is all too easy for a researcher to set aside those standard procedures, to p-hack, and just report on and write a paper for each result with a nominally significant p-value.
P-hacking by Asking Multiple Questions
As noted above, a standard form of p-hacking is for a researcher to run statistical analyses until a statistically significant result appears—and publish the one (likely spurious) result. When researchers ask hundreds of questions, when they are free to use any number of statistical models to analyze associations, it is all too easy to engage in this form of p-hacking. In general, research based on multiple analyses of large complex data sets is especially susceptible to p-hacking, since a researcher can easily produce a p-value < 0.05 by chance alone.268 Research that relies on combining large numbers of questions and computing multiple models is known as Multiple Testing and Multiple Modeling.269
Confirmation bias compounds the difficulties of observing a chance p-value < 0.05. Confirmation bias, frequently triggered by HARKing that falsely conflates exploratory research with confirmatory research, influences researchers so that they are more likely to publish research that confirms a dominant scientific paradigm, such as the association of an air component with a health outcome, and less likely to publish results that contradict a dominant scientific paradigm.
P-value Plots
Now we put together several concepts that we have introduced. When we conduct a null hypothesis statistical test, we can produce a single p-value that can fall anywhere in the interval from 0 to 1, and which is considered “statistically significant” in many disciplines when it is less than 0.05. We also know that researchers often look at many questions and compute many models using the same observational data set, and that this allows them to claim that a small p-value produced by chance substantiates a claim to a significant association.
Consider the following example.270 Researchers made a claim that by eating breakfast cereal a woman is more likely to have a boy baby.271 The researchers conducted a food frequency questionnaire (FFQ) study that asked pregnant women about their consumption of 131 foods at two different time points, one before conception and one just after the estimated date of conception. The FFQ posed a total of 262 questions. The researchers obtained a result with a p-value less than 0.05 and claimed they had discovered an association between maternal breakfast cereal consumption and fetal sex ratios. Their procedure made it highly likely that they had simply discovered a false positive association.
We cannot prove that any one such result is a false positive, absent a series of replication experiments. But we can detect when a given result is likely to be a false positive, drawn from a larger body of questions that indicate randomness rather than a true positive association.
The way to assess a given result is to make a p-value plot of the larger body of results that includes the individual result, and then plot the reported p-values of each of those results. We then use this p-value plot to examine how uniformly the p-values are spread over the interval 0 to 1. We use the following steps to create the p-value plot.
● Rank-order the p-values from smallest to largest.
● Plot the p-values against the integers: 1, 2, 3, …
When we have created the p-value plot, we interpret it like this:
● A p-value plot that forms approximately a 45-degree line (i.e., slope = 1) provides evidence of randomness—a literature that supports the null hypothesis of no significant association.
● A p-value plot that forms approximately a line with a flat/shallow slope < 1, where most of the p-values are small (less than 0.05), provides evidence for a real effect—a literature that supports a statistically significant association.
● A p-value plot that exhibits bilinearity—that divides into two lines—provides evidence of publication bias, p-hacking, and/or HARKing.272
Why does a plotted 45-degree line of p-value results provide evidence of randomness? When a researcher conducts a series of statistical tests to test a hypothesis, and there is no significant association, the individual results ought to appear anywhere in the interval 0 to 1. When we rank these p-values and plot them against the integers 1, 2, … , they will produce a 45-degree line that depicts a uniform distribution of results. The differences between the individual results, in other words, differ from one another regularly, and produce collectively a uniform distribution of results.
Whenever we plot a body of linked p-value results, and the results plot to a 45-degree line, that is evidence that an individual result is the result of a random distribution of results—that even a putatively significant association is really only a fluke result, a false positive, where the evidence as a whole supports the null hypothesis of no significant association.
We may take this as evidence of randomness whether we apply it to:
● a series of individual studies focused on one question,
● a series of tests that emerge by uncontrolled testing of a set of different predictors and different outcomes, or
● a series of meta-analyses.273
The null hypothesis assumption is that there is no significant association. This presumption of a random outcome, of no significant association, must be positively defeated in a hypothesis test in order to make a claim of a significant, surprising result.274 The corollary is that an individual result of a significant association can only be taken as reliable if any body of results to which it belongs also positively defeats the p-value plot of a 45-degree line that depicts a uniform distribution of results.275
Let us return to the research linking breakfast cereal with increased conception of baby boys. That statistical association was drawn from 262 total questions, each of which produced its own p-value. When we plot the reported p-values of all 262 of those questions, in Figure 14 below, the result is a line of slope 1 (approximately).
Figure 14: P-value Plot, 262 P-values, Drawn from Food Frequency Questionnaire, Questions Concerning Boy Baby Conception276
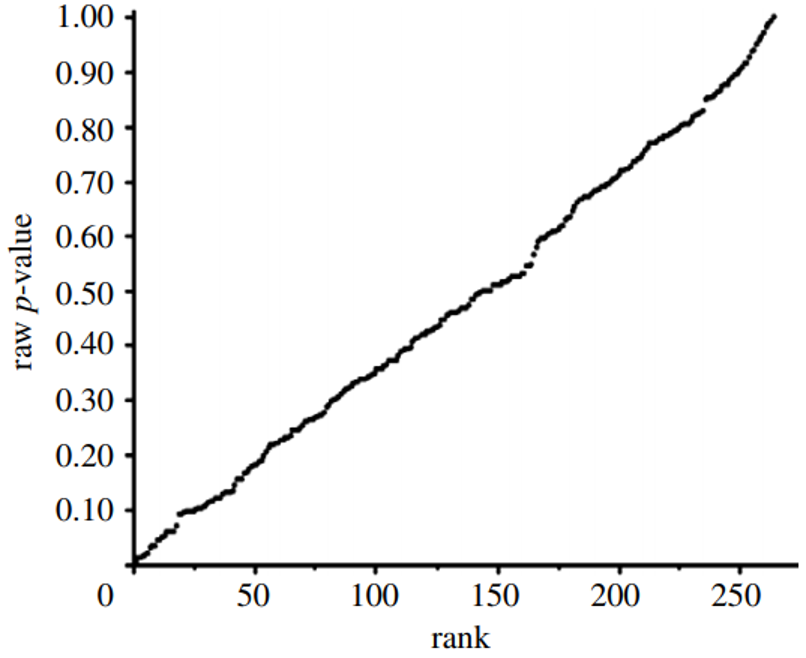
This line supports the presumption of randomness as a 45-degree line starting at the origin 0,0 would fit the data very well. The small p-value, less than 0.05, registered for the association between breakfast cereal consumption and boy-baby conception, represents a false positive finding.
P-value plotting likewise reveals randomness, no significant association, when applied in Figure 15 to a meta-analysis that combined data from 69 questions drawn from 40 observational studies. The claim being evaluated in the meta-analysis was whether long-term exercise training of elderly is positively associated with greater mortality and morbidity (increased accidents and falls and hospitalization due to accidents and falls).
Figure 15: P-value Plot, 69 Questions Drawn From 40 Observational Studies, Meta-analysis of Observational Data Sets Analyzing Association Between Elderly Long-term Exercise Training and Mortality and Morbidity Risk277
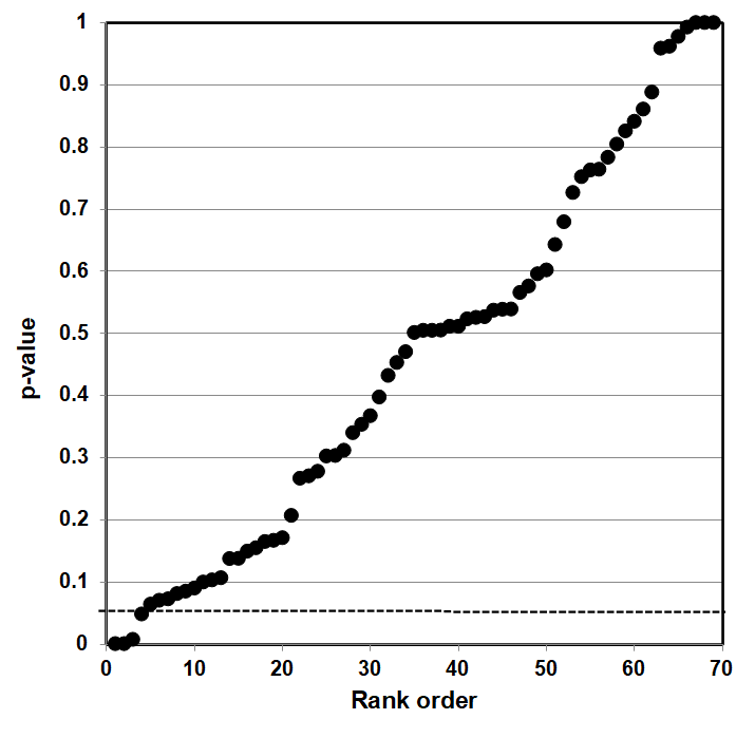
Figure 15, as Figure 14, plots the p-values as a sloped line from left to right at approximately 45-degrees, and therefore supports the presumption of randomness. Note that Figure 15 contains four p-values less than 0.05, as well as several p-values close to 1.000. The p-values below p = 0.05 are most likely false positives.
These claims are purely statistical. Researchers can, and will, argue that discipline-specific information justifies treating their particular claim for a statistical association—that “relevant biological knowledge,” for example, supports the claim that there truly is an association between breakfast cereal consumption and boy-baby conception.278
We recognize the possibility where statisticians and disciplinary specialists talk past one another and refuse to engage with the substance of one another’s arguments. But we urge disciplinary specialists, and the public at large, to consider how extraordinarily unlikely it is for a p-value plot indicating randomness to itself be a false positive. The counter-argument that a particular result truly registers a significant association needs to refute the chances against such a 45 degree line appearing if the individual results were not the consequence of selecting false positives for publication.
Such a counter-argument should also consider that p-value plotting does register true effects. We applied the same method to produce a p-value plot in Figure 16 of studies that examined a smoking-lung cancer association.
Figure 16: P-value Plot, 102 Studies, Association of Smoking and Squamous Cell Carcinoma of the Lungs279
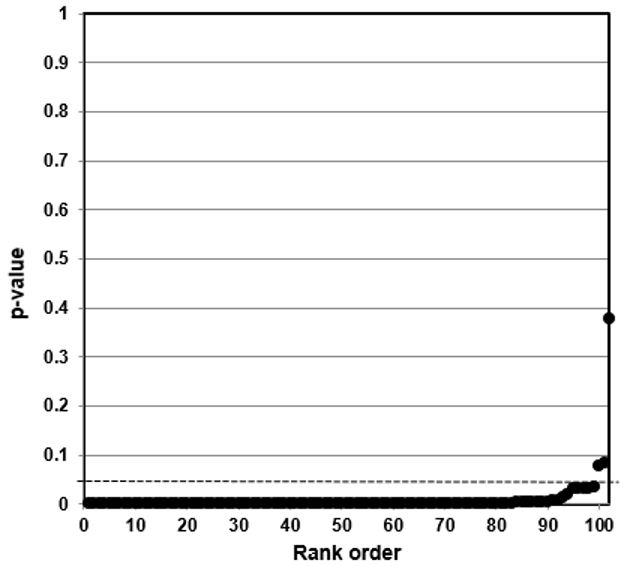
In this case, the p-value plot did not form a roughly 45-degree line, with uniform p-value distribution over the interval. Instead it formed an almost horizontal line, with the vast majority of the results well below p = 0.01. Only 3 out of 102 p-values were above p = 0.05. One outlying p-value was just below 0.40—which reminds us that even where there is a true strong relationship, a few studies may produce false negatives. Our p-value plot provides evidence that the studies associating smoking and lung cancer had discovered a true association.
Bilinear P-value Plots
Our method also registers bilinear results (divides into two lines). In Figure 17, we plotted studies that analyze associations between fine particulate matter and the risk of preterm birth or term low birth weight. A 45-degree line as in Figures 14 and 15 indicates randomness, no effect, and therefore strongly suggests that researchers have indulged in HARKing if they claim a positive effect. A bilinear shape instead suggests the possibility of publication bias, p-hacking, and/or HARKing—although there remains some possibility of a true effect.
Figure 17: P-value Plot, 23 Studies, Association of Fine Particulate Matter (PM2.5) and the Risk of Preterm Birth or Term Low Birth Weight280
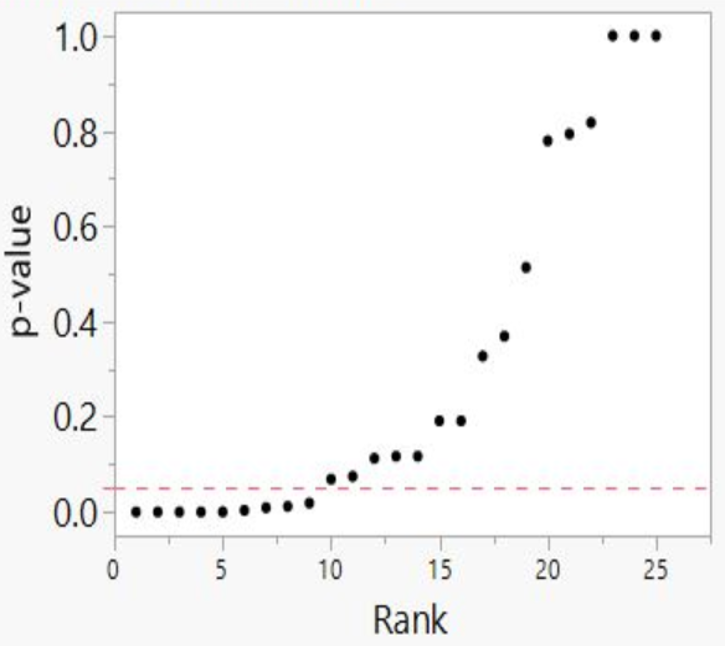
As we shall explain, such a bilinear plot should usually be interpreted as providing evidence that bias described above has affected a given field, albeit not as strong as the evidence that a 45-degree line provides evidence of no effect. Still, researchers would have good cause to query a claim of an association between fine particulate matter and the risk of preterm birth or term low birth weight, even if a true effect cannot be absolutely ruled out.
Figure 16 demonstrates that our method can detect true associations—it will not come back with a 45-degree line no matter what data you feed into it. When it does detect randomness, as in Figures 14 and 15, the inference is that a particular result is likely to be random, and that the claimed result has failed a statistical test that a true positive body of research passes.
When a p-value plot exhibits bilinearity, as in Figure 17, that provides evidence that there are 1) missing p-values—missing results, which ought to complete the (null) line; and/or 2) p-hacked results, which have driven results down from what they should be to results smaller than the professionally designated level of statistical significance. Bilinearity, in other words, provides evidence that a field has been subject to publication bias—either that negative results have gone into the file drawer or that published results are the result of p-hacking, and/or HARKing.
Our test is useful for assessing the scientific literature precisely because it provides reasonable possibilities for both success and failure.281 We should emphasize that this method is not meant to present an unanswerable disproof of any study or literature to which it is applied. As noted above, the authors of the claim associating maternal breakfast cereal consumption with altered fetal sex ratios made a counter-argument to our critique, and to the argument for randomness displayed in Figure 14. We urge all scholars and interested citizens to examine these counter-arguments. Scientific discovery proceeds by the scrutiny of such arguments and counter-arguments.282
We claim that our p-value plot method provides a useful test to check claims against the null-hypothesis. Any such claims ought as a general rule to survive the test of our method—particularly if they are to be used to influence government policy.
P-value plots are an essential component of the rigorous statistical testing that must now be considered the scientific gold standard. Even meta-analyses exclusively relying on studies of RCTs, which use admirably rigorous study designs,283 can display bilinear p-value plots. P-value plotting provides evidence that while RCT studies may be necessary to produce rigorous science, they are not sufficient unless they have been subjected to equally rigorous statistical testing.
Where government regulatory policy depends on the claim that such positive associations exist, the existence of a bilinear p-value plot provides a very strong argument that a body of literature has not actually proved the existence of an association to the level that justifies government regulation. A bilinear p-value plot provides a good rule of thumb: a government agency has not yet acquired the rigorously tested body of scientific research needed to justify regulation.
P-value plotting isn’t itself a cure-all. The procedure might not be able to tell when an entire literature consists of biased results. P-value plotting cannot detect every form of systematic error. But it is a useful tool, which allows us to detect a strong likelihood that a substantial portion of government regulation has been built on inconsistent science.
We note here that p-value plotting is not the only means available by which to detect publication bias, p-hacking, and HARKing in meta-analyses. Scientists have come up with a broad variety of statistical tests to account for such frailties in base studies as they compute meta-analyses. Unfortunately, publication bias and questionable research procedures in base studies severely degrade the utility of existing means of detection.284 We proffer p-value plotting not as the first means to detect publication bias and p-hacking in meta-analyses, but as a better means than alternatives which have proven ineffective.
Appendix 5: Meta-Analyses: Definition and Use
A meta-analysis is a systematic procedure for statistically combining data from multiple published papers that address a common research question—for example, whether a specific factor is a likely cause or origin of a health outcome such as a stroke or a heart attack. Scientists can conduct meta-analyses relatively easily. Researchers use computer programs to search the published literature, sort quickly through titles, abstracts, and full-texts of papers, and select ca. 10−20 papers from the hundreds to thousands of papers initially identified as candidates for meta-analysis.
The set of papers chosen for a single meta-analysis itself requires careful study so as to select properly comparable and on-topic papers and include all the relevant studies.285 In the well-established cottage industry of meta-analysis studies, a skilled team of 5−15 researchers can turn out one meta-analysis per week.286 Researchers publish approximately 5,000 meta-analysis studies per year.287
Many government agencies now depend upon meta-analyses. The flood of papers on any given topic makes it difficult even for an expert to stay abreast of all the literature, and a meta-analysis provides a convenient way to digest the results of many individual papers. Government agencies also wish to base their policy on a broad spectrum of rigorous, comparable research, rather than just one or a few individual studies. Meta-analyses offer the promise that government agencies are indeed using such research. Meta-analyses also offer what appears to be an impartial protocol that can provide a safeguard against the danger of biased expert judgment.
Yet meta-analyses are not a cure-all. Meta-analyses can themselves be affected by publication bias, and by almost every other form of irreproducibility-crisis research error that affects individual studies.288 For example, when researchers vary meta-analyses’ inclusion and exclusion criteria—the criteria stating which studies to include in a meta-analysis and which to exclude—they can produce wildly varying results.289 In other words, researchers who do not pre-register their inclusion and exclusion criteria can HARK their meta-analyses.
Meta-analyses’ reliability also depends on their base studies’ reliability—and if those have been affected by publication bias or other infirmities (e.g., failure to apply MTMM to control for experiment-wise error), then the meta-analyses they are conducting are no more than Garbage In, Garbage Out (GIGO). Funding bias can affect meta-analyses—and where government agencies are concerned, it is worth emphasizing that government funding can produce substantial funding bias.290
Evaluation
Qualitative study of meta-analyses is a burgeoning field, which should repay further development.291 We will focus here, however, on the quantitative, statistical study of meta-analyses’ validity—an approach made possible by the extraordinary growth in the number of meta-analyses.
When we refer to a research ‘claim’ in our discussion below, we mean that a study makes a claim of a positive association between a factor investigated and an outcome based on finding small p-values (less than 0.05) in their research. As it is a statistical claim being made by the meta-analysis researchers, we can evaluate the reliability of the claim from a statistical point-of-view. We can use p-value plotting to evaluate published meta-analyses, as we did in Figures 14-17, and thereby uncover problems in the way these meta-analyses have been interpreted.
When we plot an approximately 45-degree line, we acquire good evidence for the null hypothesis. When we plot bilinearity, we acquire evidence of publication bias, p-hacking, and/or HARKing—and significant evidence against any claim of a consistent overall positive association between cause and outcome across the studies used in that particular meta-analysis. At the very least, we have acquired evidence that some unidentified covariate complicates the putative relationship.292
We noted above that government agencies rely heavily on meta-analyses to justify regulation. They do not as yet subject these meta-analyses to p-value plotting—and we believe that their failure to do so denies them a very useful tool for assessing the validity of such meta-analyses. P-value plotting that establishes bilinearity does not disprove the meta-analysis. The significant associations could be true; the random results in error. But given the known incentives toward publication bias, p-hacking, and HARKing, bilinearity says we should take meta-analyses’ claims to have detected positive associations with a big grain of salt.
Appendix 6: HARKing: Exploratory Research Disguised as Confirmatory Research
To HARK is to hypothesize after the results are known—to look at the data first and then come up with a hypothesis that provides a statistically significant result.293 Irreproducible research hypotheses produced by HARKing send whole disciplines chasing down rabbit holes, as scientists interpret their follow-up research to conform to a highly tentative piece of exploratory research that was pretending to be confirmatory research.
Scientific advance depends upon scientists maintaining a distinction between exploratory research and confirmatory research, precisely to avoid this mental trap. These two types of research should utilize entirely different procedures. HARKing conflates the two by pretending that a piece of exploratory research has really followed the procedures of confirmatory research.294
Jaeger and Halliday provide a useful brief definition of exploratory and confirmatory research, and how they differ from one another:
Explicit hypotheses tested with confirmatory research usually do not spring from an intellectual void but instead are often gained through exploratory research. Thus exploratory approaches to research can be used to generate hypotheses that later can be tested with confirmatory approaches. ... The end goal of exploratory research ... is to gain new insights, from which new hypotheses might be developed. ... Confirmatory research proceeds from a series of alternative, a priori hypotheses concerning some topic of interest, followed by the development of a research design (often experimental) to test those hypotheses, the gathering of data, analyses of the data, and ending with the researcher’s inductive inferences. Because most research programs must rely on inductive (rather than deductive) logic..., none of the alternative hypotheses can be proven to be true; the hypotheses can only be refuted or not refuted. Failing to refute one or more of the alternative hypotheses leads the researcher, then, to gain some measure of confidence in the validity of those hypotheses.295
Exploratory research, in other words, has few predefined hypotheses. Researchers do not at first know what precisely they’re looking for, or even necessarily where to look for it. They “typically generate hypotheses post hoc rather than test a predefined hypothesis.”296 Exploratory studies can easily raise thousands of separate scientific claims297 and they possess an increased risk of finding false positive associations.
Confirmatory research “tests predefined hypotheses usually derived from a theory or the results of previous studies that can be used to draw firm and often meaningful conclusions.”298 Confirmatory studies ideally should focus on just one hypothesis, to provide a severe test of its validity. In good confirmatory research, researchers control every significant variable.
When multiple questions are at issue, researchers should use procedures such as Multiple Testing and Multiple Modeling (MTMM) to control for experiment-wise error—the probability that at least one individual claim will register a false positive when you conduct multiple statistical tests.299
Researchers should state the hypothesis clearly, draft the research protocol carefully, and leave as little room for error as possible in execution or interpretation. Properly conducted, confirmatory research is by its nature far less likely to find false positive associations than original research, and conclusions supported by confirmatory research are correspondingly more reliable.
Researchers resort to HARKing—exploratory research that mimics confirmatory research—not only because it can increase their publication rate but also because it can increase their prestige. HARKing scientists can gain the reputation for an overwhelmingly probable research result when all they have really done is set the stage for more follow-on false positive results or file-drawer negative results.
Another way to define HARKing is that, like p-hacking more generally, it overfits data—it produces a model that conforms to random data.300
HARKing, unfortunately, includes yet wider categories of research. When scientists preregister their research, they specify and publish their research plan in advance. All un-preregistered research can be susceptible to HARKing, as it allows researchers to transform their exploratory research into confirmatory research by looking at their data first and then constructing a hypothesis to fit the data, without informing peer reviewers that this is what they did.301 In general, researchers too frequently fail to make clear distinctions between exploratory and confirmatory research, or to signal transparently to their readers the nature of their own research.302
1 David Randall and Christopher Welser, The Irreproducibility Crisis of Modern Science: Causes, Consequences, and the Road to Reform (National Association of Scholars, 2018), https://www.nas.org/reports/the-irreproducibility-crisis-of-modern-science.
2 Fixing Science: Practical Solutions for the Irreproducibility Crisis, YouTube, https://www.youtube.com/watch?v=eee6KloEUR4&list=PL-mariB2b6NugvvjAFeAjK-_-Y6wXCkvM; “Conference Follow-up: Fixing Science,” National Association of Scholars, February 19, 2020, https://www.nas.org/blogs/article/conference-follow-up-fixing-science.
3 “UPDATED: NAS Public Comment on Strengthening Transparency in Regulatory Science,” National Association of Scholars, June 19, 2018, https://www.nas.org/blogs/article/updated_nas_public_comment_on_strengthening_transparency_in_regulatory_scie; Peter Wood, “NAS Comments on EPA's Proposed Supplemental Notice of Proposed Rulemaking,” March 23, 2020, https://www.nas.org/blogs/article/nas-comment-on-epas-proposed-supplemental-notice-of-proposed-rulemaking; “Comments on EPA’s Final Rule, ‘Strengthening Transparency’,” National Association of Scholars, January 12, 2021, https://www.nas.org/blogs/article/nas-comments-on-epas-final-rule-strengthening-transparency.
4 “Episode #51: Rabble Rousing with Lee Jussim,” https://www.nas.org/blogs/media/episode-51-rabble-rousing-with-lee-jussim; “Legally Wrong: When Courts and Science Meet with Nathan Schachtman,” https://www.nas.org/blogs/media/legally-wrong-when-politics-and-science-meet-with-nathan-schactman; David Randall, “Bad Science Makes for Bad Government,” National Association of Scholars, September 19, 2019, https://www.nas.org/blogs/article/bad-science-makes-for-bad-government; Edward Reid, “Irreproducibility and Climate Science,” National Association of Scholars, May 17, 2018, https://www.nas.org/blogs/article/irreproducibility_and_climate_science.
5 David Randall, Warren Kindzierski, and Stanley Young, Shifting Sands: Report I Keeping Count of Government Science: P-Value Plotting, P-Hacking, and PM2.5 Regulation (National Association of Scholars, 2021), https://www.nas.org/reports/shifting-sands-report-i.
6 W. M. Briggs, “Everything wrong with p-values under one roof,” in Beyond Traditional Probabilistic Methods in Economics, ECONVN 2019, Studies in Computational Intelligence, Volume 809, eds. Kreinovich V., Thach N., Trung N., Van Thanh D. (Cham, Switzerland: Springer, 2019), https://doi.org/10.1007/978-3-030-04200-4_2; Louis Anthony Cox, Jr., et al., Causal Analytics for Applied Risk Analysis (Cham, Switzerland: Springer, 2018).
7 Jason Price, et al., The Benefits and Costs of U.S. Air Pollution Regulations (Industrial Economics, Incorporated, 2020), https://www.nrdc.org/sites/default/files/iec-benefits-costs-us-air-pollution-regulations-report.pdf.
8 CFR - Code of Federal Regulations Title 21. Revised as of April 21, 2020. https://www.accessdata.fda.gov/scripts/cdrh/cfdocs/cfcfr/cfrsearch.cfm?fr=101.75.
9 Interactive Nutrition Facts Label, U.S. Food & Drug Administration, N.d., https://www.accessdata.fda.gov/scripts/interactivenutritionfactslabel/saturated-fat.cfm.
10 V. M. Gershuni, “Saturated Fat: Part of a Healthy Diet,” Current Nutrition Reports 7, 3 (2018): 85–96. https://doi.org/10.1007/s13668-018-0238-x.
11 U.S. FDA (2021). We direct our analysis and our recommendations to the FDA, but we recognize the overlapping responsibilities of such federal departments and regulatory agencies as the United States Department of Agriculture (USDA), and in particular its Food and Nutrition Service (FNS) and the Center for Nutrition Policy and Promotion (CNPP). There are other nutrition organizations within the Department of Health and Human Services, such as the Office of Nutrition Research in the National Institutes of Health, the Office of Disease Prevention and Health Promotion, and the Centers for Disease Control.
12 Kavanaugh (2007).
13 Boeing (2013).
14 Boeing (2013); Satija (2015).
15 Satija (2015).
16 E.g., U.S. Food and Drug Administration Guidance Documents (2006); U.S. Food and Drug Administration Guidance Documents (2009).
17 Lopez and Martos (2004).
18 Willett (1985); GS (2021c).
19 Satija (2015).
20 Egger (2001).
21 D’Elia (2012).
22 Archer (2015).
23 Ioannidis (2018).
24 Food components are generally tested individually. Several foods could contain a common potentially toxic chemical. The effect of the individual foods might not register statistically, so the effect of the chemical would go undetected—oxalate and kidney stones is a likely example. See Curhan (1993).
25 Béjar (2017); Williams (2020).
26 GS (2021a).
27 GS (2021a).
28 GS (2021b).
29 Grimes (2002).
30 Pearson (2016).
31 Willett’s initial FFQ listed 61 foods. Willett (1985).
32 Of course, a covariate can be used with multiple levels, which would expand the analysis search space.
33 Westfall (1993).
34 Pyne (2015).
35 Young (2021a).
36 Head (2015); Hubbard (2015); Aschwanden (2016); Ruxton (2016); Chamber (2017); Harris (2017).
37 Schoenfeld (2013).
38 Bolland (2014).
39 Westfall (1993); Benjamini (1995).
40 Young (2021a).
41 NASEM (2019).
42 Rothman (1990).
43 Sarewitz (2012); Baker (2016).
44 Randall (2018); Young (2021a).
45 Al-Marzouki (2005); Couzin (2006); Redman (2013); Ritchie (2020).
46 Buchanan (2004); Young (2021a).
47 Sarewitz (2012); Baker (2016).
48 Boos (2011).
49 Clyde (2000); Gelman (2014); Hubbard (2015); Chamber (2017); Harris (2017); Briggs (2017, 2019).
50 Johnson (2013); Benjamin (2018).
51 NASEM (2016, 2019).
52 Baker (2016).
53 Begley (2012); and see Gerber (2008) [sociology]; Michaels (2008) [climate science]; Franco (2014) [social sciences]; Diener (2018) [psychology].
54 Gelman (2014).
55 Young (2021a).
56 Kuhn (2016); IQA (2001).
57 NASEM (2016).
58 Young (2021a).
59 Peace (2018).
60 Ioannidis (2018); Gorman (2020).
61 Gorman (2020).
62 Vernooij (2019).
63 Blanco Mejia (2018).
64 Young (2021c); Young (2021d).
65 Williams notes that the FDA requires rigorous evidence from manufacturers who wish to substantiate health claims, but allows far weaker evidence to substantiate its regulatory initiatives. Williams (2020).
66 Milestones (2018).
67 Fact Sheet (2021).
68 Junod (2008).
69 Junod (2008).
70 U.S. FDA (2021).
71 Ellwood (2010); U.S. FDA (1997); U.S. FDA Centre for Food Safety and Applied Nutrition (2013).
72 U.S. FDA (2021).
73 Kavanaugh (2007).
74 E.g., U.S. Food and Drug Administration Guidance Documents (2006); U.S. Food and Drug Administration Guidance Documents (2009).
75 Hasler (2008).
76 U.S. Food and Drug Administration Guidance Documents (2009).
77 Schneeman (2007).
78 Barton (2000). RCTs do not as yet standardly account for the latest research, which is broadening our knowledge of the substantial individual and group variation in response to nutritional substances. Cecil and Barton (2020). While we do not address this particular weakness in RCTs in this report, scientists should also take account of it.
79 Byers (1999b); Freudenheim (1999); Prentice (2010); Sempos (1999).
80 Kavanaugh (2007).
81 Byers (1999a).
82 Boeing (2013); Satija (2015).
83 Satija (2015). Causal criteria in nutritional epidemiology include consistency, strength of association, dose response, plausibility, and temporality. Potischman (1999).
84 Boffetta (2008); NASEM (2016); NASEM (2019); Randall (2018); Sarewitz (2012).
85 Gotzsche (2006).
86 Byers (1999b).
87 E.g., U.S. Food and Drug Administration Guidance Documents (2006); U.S. Food and Drug Administration Guidance Documents (2009).
88 E.g., Liu (1994); Kristal (2005); Shim (2014).
89 U.S. Food and Drug Administration Guidance Documents (2017).
90 See Byrnes (2001); Støvring (2007); Gotzsche (2006); Gullberg (2009); Kmietowicz (2014). For the Brian Wansink scandal, see Hamblin (2018); Randall and Welser (2018).
91 Schneeman (2007).
92 D'Souza (2020); Marks (2011); Schutz (2021).
93 Blázquez (2021).
94 CFR (2020).
95 INFL (n.d.).
96 Gershuni (2018).
97 And see Peretti (2013).
98 Vernooij (2019).
99 Blanco Mejia (2018).
100 U.S. FDA (2017).
101 Peace (2018).
102 Egger (2001).
103 Peace (2018); Malik (2010).
104 Young (2021a).
105 Peace (2018).
106 Peace (2018).
107 N is the number of questions/models at issue; Expected deviation is expected deviation from zero for a normal distribution for the given sample size, N; p-value is the expected smallest p-value from N. Table values extracted from Peace (2018).
108 Cleophas (2015); Fisher (1950); Young (2021a); Young (2021b). Note that Young (2021b) includes a direct critique of the method of combining risk ratios promoted in DerSimonian (1986).
109 Vernooij (2019).
110 Blanco Mejia (2018).
111 Altman (2011a); Altman (2011b).
112 Schweder (1982).
113 Schweder (1982); Hung (1997); Bordewijk (2020).
114 Schweder (1982). For p-value plot formation and other analysis details, see also Young (2018); Young (2019).
115 Randall (2018); Ritchie (2020).
116 Ellenberg (2014); Hubbard (2015); Chambers (2017); Harris (2017); Streiner (2018).
117 Boffetta (2008); Ioannidis (2011); McLaughlin (2013); Simonsohn (2014).
118 Young (2021a).
119 Carter (2019).
120 Westfall (1993); Nissen (2016).
121 Figure 3 presents results of 18 GS searches performed on 22 March 2021 with each separate search with the exact phrase “food frequency questionnaire” and one of the 18 “health outcomes” anywhere in the article. Note: a GS search is only an approximation as the literature changes rapidly and small changes in search specifications can change the results.
122 Vernooij (2019).
123 Peace (2018); Young (2019); Young (2021a).
124 Schweder (1982).
125 Vernooij (2019).
126 Guyatt (2008).
127 Moher (2009).
128 Vernooij (2019).
129 For professional responses to this and related studies, see Expert Reaction (2019).
130 Vernooij (2019).
131 Creswell (2013).
132 Vernooij (2019). Citation# is Vernooij et al. reference number, Author name is first author listed for reference; Year = publication year; Foods = # of foods used in Food Frequency Questionnaire; Tests = Outcomes × Predictors; Models = 2^k where k = number of Covariates; Search Space = approximation of analysis search space = Tests × Models.
133 Willett (1985).
134 Chan (2013).
135 Héroux (2010).
136 Foods = # of foods used in Food Frequency Questionnaire; Tests = Outcomes × Predictors; Models = 2^k where k = number of Covariates; Search Space = approximation of analysis search space = Tests × Models. The lower quartile is the average of the fourth and the fifth lowest number in each category; the upper quartile is the average of the fourth and the fifth highest number in each category.
137 Willett (1985).
138 Citation# = Vernooij et al. reference number, Author name = first author listed for reference; Year = publication year; Cohort Name = name of study cohort; Papers = # of papers in literature mentioning study cohort; Papers, Cohort + FFQ = # of papers in literature mentioning study cohort using a Food Frequency Questionnaire (FFQ). Figure 6 presents the results of 30 GS searches performed on 22 October 2021. For 15 GS searches, the phrase “cohort study name” was specified where the phrase occurs anywhere in the article. For the other 15 GS searches, the phrase “cohort study name” and the term “food frequency questionnaire” was specified where the phrase and term occur anywhere in the article. Note: a GS search is only an approximation as the literature changes rapidly and small changes in search specifications can change the results.
139 Papers = # of papers in literature mentioning study cohort; Papers, Cohort + FFQ = # of papers in literature mentioning study cohort using a Food Frequency Questionnaire (FFQ).
140 Young (2019a).
141 Al-Marzouki (2005); Boos 2011; Roberts (2007); Bordewijk 2020.
142 Roberts (2007); Redman (2013); Bordewijk 2020.
143 Vernooij (2019). Note: In the table we use the exponent “E” to represent 10; for example, 5.97E-12 is 5.97 x 10^-12.
144 Boos (2011).
145 Young (2008).
146 Boffetta (2008).
147 Gotzsche (2006).
148 Figure 10 presents the results of 23 GS searches performed on 3 August 2021 with the phrase “cohort study name”, where the phrase occurs anywhere in the article for each search. Note: (1) there are 23 study cohorts listed with one cohort (Adventist Health Study 2 (AHS-2)) used twice; (2) a GS search is only an approximation as the literature changes rapidly and small changes in search specifications can change the results.
149 Note that there are 25 studies and 24 cohorts as two studies used the same cohort.
150 Rank = p-value rank; Citations = # of citations in literature mentioning study cohort; RR = Relative Risk; CLlow = lower confidence limit; CLhigh = upper confidence limit.
151 Blanco Mejia (2019).
152 Blanco Mejia (2019).
153 Blanco Mejia (2019).
154 Blanco Mejia (2019).
155 Blanco Mejia (2019).
156 Creswell (2013).
157 Citation# is Blanco Mejia et al. reference number, Author name is first author listed for reference; Year = publication year; Tests = Outcomes × Predictors; Models = 2^k where k = number of Covariates; Search Space = approximation of analysis search space = Tests × Models; Medians = 20 (Tests), 1 (Models), 24 (Search Space).
158 Hariton (2018).
159 As noted above, RCTs do not as yet standardly account for the latest research, which is broadening our knowledge of the substantial individual and group variation in response to nutritional substances. Cecil and Barton (2020). While we do not address in this report this particular weakness in RCTs, scientists should also take account of it.
160 For example, see Battaglia (2015); Ekmekcioglu (2018).
161 WHO (2015).
162 Delgado (2021).
163 Bueno (2013); Castellana (2021); Taubes (2021).
164 Vernooij (2019).
165 Guyatt (2008).
166 Monaco (2019); Arends (2020).
167 Peace (2018).
168 Stroup (2000).
169 GS (2021d).
170 Rothman (1990).
171 Fisher (1950); DerSimonian (1986).
172 Young (2019a).
173 Héroux (2010).
174 Head (2015).
175 Bross (1990); Bross (1991); Feinstein (1988b); Schneiderman (1991).
176 Feinstein (1988a); Feinstein (1988b); Mayes (1988); Al-Marzouki (2005); Marcovitch (2007); Roberts (2007, 2015); Redman (2013); Grey (2020); Hayden (2020); Bordewijk (2020); Smith (2021).
177 Tugwell (2017).
178 George (2016).
179 Retraction Watch (2021).
180 Roberts (2007); Roberts (2015); Redman (2013); Bordewijk (2020).
181 See Mehra (2020) and Open Letter (2020).
182 Young (2012).
183 DerSimonian (1986).
184 ORI (n.d.).
185 Redman (2013).
186 IQA (2000); OMB (2019).
187 Westfall (1993).
188 Ge (2003).
189 Jones (2019a); Jones (2019b); and see Romano (2016).
190 Cox (2008); Meinshausen (2011).
191 For the concept of “severe testing,” see Mayo (2018).
192 Cf. Van der Laan (2011).
193 Ioannidis (2013, 2018); Trepanowski (2018).
194 Carter (2019).
195 Swaen (2001).
196 El Emam (2009).
197 Smith (2021).
198 Cf. Van der Laan (2011).
199 Such federal departments and regulatory agencies include the United States Department of Agriculture (USDA), and in particular its Food and Nutrition Service (FNS) and the Center for Nutrition Policy and Promotion (CNPP). There are other nutrition organizations within the Department of Health and Human Services, such as the Office of Nutrition Research in the National Institutes of Health, the Office of Disease Prevention and Health Promotion, and the Centers for Disease Control.
200 Begley (2015).
201 Randall (2020).
202 Kristal (2005); Ioannidis (2013); Ioannidis (2018); Trepanowski (2018); Gorman (2020).
203 Fanelli (2018).
204 Chambers (2017); Harris (2017); Hubbard (2015); Ritchie (2020).
205 Westfall (1993).
206 Friedman (1959).
207 Case (1985); Shekelle (1985a); Shekelle (1985b).
208 Heinonen (1974).
209 Curb (1982); Labarthe (1980).
210 Shapiro (2004).
211 Mayes (1988).
212 Feinstein (1988b).
213 Westfall (1993); Mayo (2018).
214 E.g., Erikssen (1980); Garrison (1976).
215 Westfall (1985).
216 Rothman (1990).
217 Westfall (1993).
218 GS (2020a).
219 Genetic epidemiology researchers cite Westfall (1993) fairly frequently, but not epidemiologists in other subdisciplines. As of October 2020, Westfall (1993) has been cited twice in Environmental Health Perspectives, once in American Journal of Epidemiology, once in International Journal of Epidemiology, and never in Annals of Epidemiology or Epidemiology.
220 Clyde (2000).
221 GS (2020b). The two citing articles are Moolgavkar (2013); Roberts (2010).
222 Hayat (2017).
223 NASEM (1991).
224 Altman (2011a); Altman (2011b).
225 Given the assumption that the null hypothesis is actually true, the p-value indicates the frequency with which the researcher, if he repeated his experiment by collecting new data, would expect to obtain data less compatible with the null hypothesis than the data he actually found. A p-value of 0.20, for example, means that if the researcher repeated his research over and over in a world where the null hypothesis is true, only 20% of his results would be less compatible with the null hypothesis than the results he actually got.
226 NASEM (2019); Randall (2018).
227 Briggs, Trafimow, and others reject the use of p-values for analyzing and interpreting data. Briggs (2016); Briggs (2019); Trafimow (2018); and see Berger (1987); Cohen (1994). They argue that null hypothesis significance testing, p-values and the like are irredeemably flawed and that they should never be used in any way. We do not dispute this argument—but neither do we use it in this particular critique. As risk ratios and confidence intervals are common statistical measures in nutritional epidemiology, our use of p-values is in any case as a complementary measure of confidence intervals for p-value plotting. McCormack (2013); Montgomery (2003). We do generally recommend that nutritional epidemiologists address the critique by Briggs, et al.
228 Ritchie (2020); and see Joseph (2020).
229 Randall (2018).
230 Chambers (2017); Harris (2017); Hubbard (2015); Randall (2018); Ritchie (2020).
231 Fanelli (2009); John (2012); Randall (2018); Ritchie (2020); Schwarzkopf (2014); Simonsohn (2014).
232 Bruns (2016); Head (2015); but see Hartgerink (2017); Tanner (2015).
233 NASEM (2016); NASEM (2019); Nosek (2020); Pellizzari (2017).
234 Goodman (2016).
235 We define reproducibility throughout our report as the testing and reproducing of an experiment’s underlying hypothesis using fresh data and/or a new method of analysis. Psychologists also conduct conceptual replications, “the attempt to test the same theoretical process as an existing study, but that uses methods that vary in some way from the previous study”(Crandall 2016). The biomedical literature, however, does not refer to conceptual replication (NASEM 2016), and we have not innovated by using it in this report. We note the general importance and usefulness of conceptual replication, however, and we recommend that professionals in other disciplines consider whether it can be adapted usefully for their own research procedures.
236 Halsey (2015); Ioannidis (2005); Randall (2018).
237 Baker (2016).
238 Archer (2020); Chawla (2020); Coleman (2019); Engber (2017); Gobry (2016); Hennon (2019); Herold (2018); Ioannidis (2005); Manuel (2019); NASEM (2019); Randall (2018); Yong (2018); Young (2018); Zeeman (1976); Zimring (2019).
239 Merton (1973); and see Anderson (2010); Kim (2018).
240 Sample (2019).
241 Buchanan (2004); Edwards (2017); Freese (2018); Glaeser (2006); and see Keller (2015); Shapin (1994).
242 Buchanan (2004).
243 Cecil (1985); Feinstein (1988b).
244 Ritchie (2020).
245 Martino (2017); Lilienfeld (2017).
246 Cordes (1998); Kaiser (2017); Roche (1994).
247 E.g., Oreskes (2010).
248 Young (2011).
249 Open Science Collaboration (2015).
250 Bidel (2013); Chambers (2017); Harris (2017); Hubbard (2015); MacMahon (1981).
251 Feinstein (1988b); Ogden (2011); Schachtman (2011); Schroter (2008); Smith (2010).
252 E.g., EPA (n.d.).
253 Taleb (2018).
254 Randall (2018); Ritchie (2020).
255 Allison (2016).
256 Olson (2002); Nissen (2016); Randall (2018).
257 Chambers (2017); Harris (2017); Hubbard (2015); Ritchie (2020).
258 We use RCTs in the remainder of this report to refer both to “randomized controlled trials” and to “randomized clinical trials”; both terms are common in the literature, and they are roughly equivalent.
259 Dickersin (1987).
260 Franco (2014).
261 Michaels (2008).
262 Kühberger (2014).
263 Gerber (2008).
264 McCambridge (2007).
265 Coronado-Montoya (2016).
266 Ioannidis (2011).
267 Westfall (1993).
268 Chambers (2017); Glaeser (2006); Harris (2017); Hubbard (2015); Ritchie (2020); Westfall (1993).
269 Westfall (1993).
270 Young (2009).
271 Mathews (2008).
272 Young (2019a); Young (2019b); Young (2019c).
273 Schweder and Spjøtvoll applied p-value plotting to evaluate many different questions. Schweder (1982). We apply p-value plotting to evaluate meta-analyses devoted to a single question; we believe our application of p-value plotting is original.
274 Fisher (1925); Fisher (1935); Mayo (2018).
275 An individual p-value that is extraordinarily small ( = far below 0.05), after adjustment for multiple testing, also has potential evidentiary value—but this occurs rarely in well-designed and executed nutritional epidemiology studies that control properly for bias and MTMM.
276 Young (2009). We acquired the data from the original researchers, who to our knowledge have not yet made it public. Interested scholars who wish to reproduce our analysis should contact the original researchers.
277 De Souto Barreto (2019).
278 Mathews (2009).
279 Lee (2012).
280 Li (2017).
281 Mayo (2018).
282 Mathews (2009).
283 Grossman (2005).
284 Carter (2019).
285 Chen (2013); Glass (1976); Stroup (2000).
286 De Vrieze (2018).
287 Ioannidis (2016).
288 Rothstein (2005); Thornton (2000).
289 Palpacuer (2019).
290 Cecil (1985); Wojick (2015).
291 Lorenc (2016).
292 Young (2019a).
293 Randall (2018); Ritchie (2020).
294 Ritchie (2020).
295 Jaeger (1998).
296 Bandholm (2017).
297 Young (2011); Young (2017).
298 Bandholm (2017).
299 Westfall (1993).
300 Ritchie (2020).
301 Wagenmakers (2012).
302 Nilsen (2020).
- How Food Regulations Get Made
- Nutritional Epidemiology’s Frail Foundations
- The Irreproducibility Crisis of Modern Science
- Reforming Government Regulatory Policy: The Shifting Sands Project
- The FDA: Best Existing Practice in the Government?
- History and Role of the U.S. Food and Drug Administration
- Nutritional Epidemiology
- Lack of Proper Multiplicity Control
- Consequences
- General Approach for Study Analysis
- P-value Plots
- Introduction
- Data Sets
- Results
- Counting
- P-Value Plots
- Introduction
- Data Sets
- Results
- Counting
- P-Value Plots
- Red and Processed Meats: Evidence of P-Hacking or Research Integrity Violations
- Soy Protein: Evidence of Research Integrity Violations
- General Conclusions
- Scope and Implementation
- Bilinear P-value Plots
- Evaluation

