


Introduction
This analysis finds that political donations from the faculty and staff of the University of Virginia go almost exclusively to the Democratic Party. If the faculty and staff are combined, the ratio of Democratic to Republican (D:R) donations is 18:1. If faculty and staff are viewed separately, for faculty the D:R ratio is 24:1 while for staff the ratio the ratio is 16:1. Of the few blue collar-staff donors whom I could identify, the D:R ratio is 11:8, much different from the white-collar staff’s ratio of 17.5:1 and the faculty’s ratio of 24:1.
I counted donations from 39 departments—including blue-collar staff, white-collar staff, librarians, and coaches of sports teams as departments along with academic departments like architecture, art, mathematics, and chemistry. Of the 39 departments, 21 employed Democratic donors but zero Republican donors. No department had Republican donors but zero Democratic donors.
The two exceptional categories are the athletic coaches and the blue-collar staff, each of which is likely to be relatively independent from the politicized organizational cultures at universities. Academics are unlikely to interact with blue-collar staff, and the importance of success of the Virginia Cavaliers is probably great enough to eliminate concerns about coaches’ political opinions.
The skewed ratios lend support to claims that Sean Stevens and I made in our 2022 paper, “Partisan Registration of Faculty in Higher Education,”: Much of the reason for high D:R ratios in colleges is their politically infused organizational cultures.1
In the past decade, diversity, equity, and inclusion (DEI) policies, including expensive DEI officers, DEI compliance requirements, and litmus tests for professors have further skewed university cultures, which had increasingly become left-oriented by the late 1920s.2 Identity studies departments, such as gender studies, also have influenced universities’ organizational cultures and personnel policies.
The UVA faculty results are similar to studies of leading research universities and liberal arts colleges. In a study conducted with Daniel B. Klein and Anthony Quain in 2016, we found that social science departments in top-tier research universities political registration ratios range from 4.5:1 in economics to 33.5:1 in history.3 The ratios in Table (2) are similar. In my study of top-tier liberal arts colleges in 2018, I found a D:R registration ratio of 10.4:1.4 There were sharp differences between departments, with the social science and humanities departments having the most extreme ratios. Left-oriented colleges have different degrees of intolerance to Republicans, with Bryn Mawr comprising zero Republicans and schools like Kenyon and St. John’s College containing 2.7: and 2.9:1 D:R ratios respectively.
In the social sciences and liberal arts studies, I looked at registration ratios, which are less extreme than the donation ratios I examine in this study and may understate the ideological sympathies of professors in colleges. In “Partisan Registration and Contributions of Faculty in Flagship Colleges,” Sean Stevens and I compared the skewness in D:R registration and donation ratios of four leading colleges in the 30 states that record voter registration. The 30 are closed-primary states that limit primary voting to voters registered with a party. Since Virginia is an open-primary state, we did not include UVA and the other leading Virginia colleges.
While voter registrations are skewed, donations are even more skewed. For example, at Columbia University we found a registration ratio of 24:1 but a donor ratio of 45:1. At Duke University there was a registration ratio of 18.5:1 and a donor ratio of 31:0. At UNC the registration ratio was 48:1 while the donor ratio was also 31:0. At the University of Florida, the registration ratio was 10.7:1 while the donor ratio was 28:1. In context, then, UVA’s ratio of 24:1 for the faculty is moderate and less than many of its peers. At the same time, the difference between 45:1 and 24:1 is only a few individuals.
In the prior studies I’ve done, I did not look at the staff, and the question rarely comes up in the literature. An exception is Sam Abrams’s New York Times op-ed in 2018.5 Abrams writes that he surveyed 900 higher-ed administrators and found a 12:1 liberal-to-conservative ratio, with six percent identifying as conservative and 71 percent identifying as liberal.
Based on his data, Abrams concludes that administrators are further to the left than professors. This is consistent with two studies I’ve conducted, which found that as one moves up the hierarchy in economics and the academic field of industrial relations the higher-ranked academics skew further to the left than do the lower-ranked academics. Thus, editors of journals are even more consistently to the left than are published authors, and published authors are more consistently to the left than mere members of the American Economic Association or Labor and Employment Relations Association.6That is consistent with organizational cultures in which left-political affiliation is an important norm or standard, a litmus test for acceptability. The recognition that important cultural norms serve as selection criteria in organizations is longstanding and well established.7
Abrams, however, is describing administrators, which likely means academic officers. Staff like secretaries, computer programmers, and financial officers are not part of the academic hierarchy. That they have nearly the same skewness as the faculty points to organizational culture as the root of the skewness. The alternative explanation, that academics have personality characteristics that just happen to be associated with Democratic Party affiliation, has been the claim of Neil Gross and other apologists for left-skewed higher education culture.8
Political Environment
US News and World Report ranks the University of Virginia 24th out of 439 national universities. Like Massachusetts, New York, and California, where a large proportion of top-tier universities are located, Virginia is a blue state, although most Virginia counties are red.
Albemarle County, in which Carlottesville is located, votes blue, but the surrounding counties—Augusta, Buckingham, Madison, Nelson, Orange, and Rockingham—vote pink or red. Ballotpedia reports that 32.2 percent of the Albemarle County vote was for the Republican presidential candidate in 2020 while 65.7 percent was for the Democratic candidate. According to The Hill, the average D:R ratio for donors last year is 37:26, so a neutral ratio would be 2.9:1 (37 x .657 : 26 x .322 = 24.3:8.4 = 2.9:1).9 For the white collar University of Virginia staff the ratio is 17.5:1, about eight times greater than the baseline.
There are possible alternative explanations to culture at the University of Virginia that are responsible for the skewness. For example, it may be that nearly 100 percent of white collar voters in Albemarle and neighboring counties are blue.
Data
We looked at campaign finance data in the Federal Elections Commission website, www.fec.gov, under the tab “Look Up Contributions from Specific Individuals.” We searched on various names for the University of Virginia such as “UVA” and “Univ. of Virginia.” Not all contributors can be captured because of inconsistencies in the way data are collected and coded. I threw out uninterpretable observations, but some of the observations I retained have missing data; for instance, departmental affiliation is missing for 18 individuals. There are a total of 2,384 included observations. Four individuals contributed to minor parties such as the Libertarian Party and were excluded from most of the analysis.
We collected data on the political committee to which the individual contributed; the year of the contribution, including three two-year cycles from 2017 to 2022; the individual’s age when available; the individual’s gender when available; and whether the individual is a member of the faculty or staff, and the departmental affiliation if a member of the faculty.
Results
Figure (1) shows the D:R ratios for the entire sample. For the faculty, the D:R ratio is 24:1; for staff, 16:1; for the blue-collar staff, it is closer to the distribution of voters in Albemarle County, 1.4:1. The same is not true for the white collar-staff donors, who more closely match the pattern of the faculty than of the local population. The discrepancy between male (14:1) and female (26:1) is similar to that found in other studies.
Table (1), a summary of the results, the column entitled “Number” shows that we found 2,255 Democratic donors and 125 Republican donors, for a D:R ratio of 18:1. The column entitled “Gender” shows that the female-to-male ratio is 1205:1001 or 1.2:1 for the Democratic donors but 48:71 or 0.68 for the Republican donors. There is a strong influence of gender in higher education political affiliations across every study I have conducted.
The column entitled “White Collar:Blue Collar” shows that for Democrats, the ratio of white-collar to blue-collar donors is 1,298:11 or 118:1, while for Republicans the ratio of white-collar to blue-collar donors is 74:8 or 9:1.
Figure 1. Results for Entire Sample
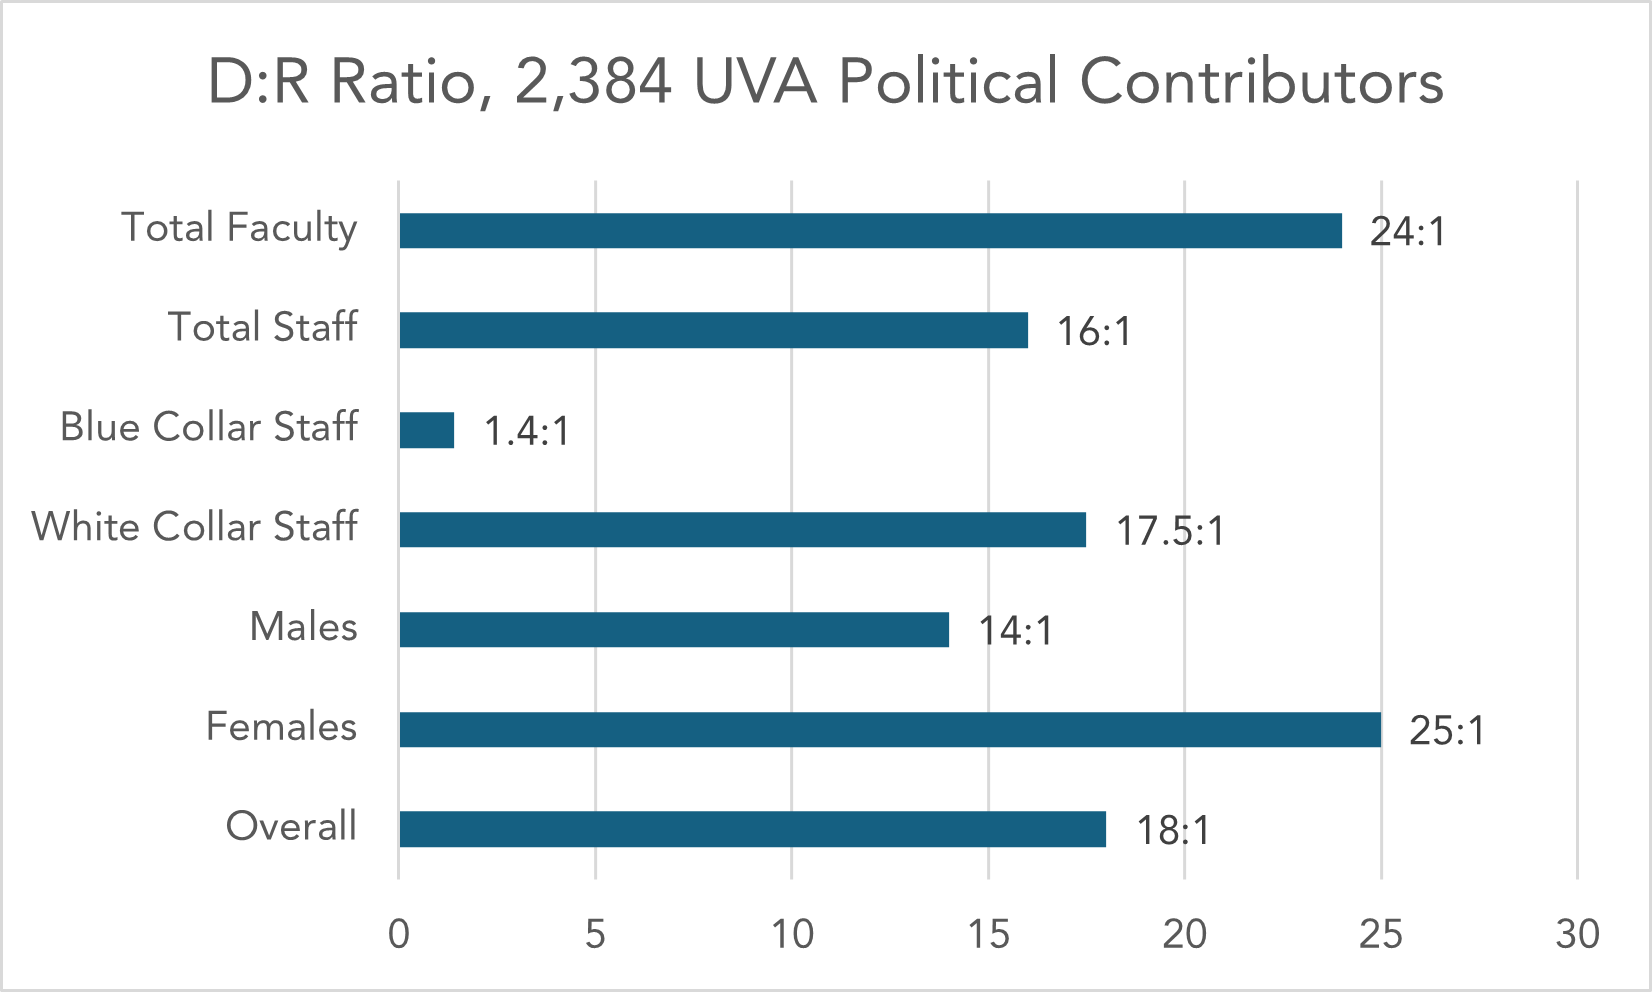
Table 1. Summary of Results
| Party | Number | Gender | Mean Age | Faculty:Staff | White Collar: Blue Collar Staff |
| D | 2255 | 1205 F 1001 M Missing: 50 | 47.9 | 879:1309* | 1298:11 |
| R | 125 | 48 F 71 M Missing: 6 | 53.4 | 37:82** | 74:8 |
| Minor Parties | 4 | 0 F 4 M | 57.3 | 2:2 | 2:0 |
| 2384 |
Departmental Ratios
21 of 39 departments have Democratic but not Republican donors. The proportions roughly follow the proportions I have found in prior work. D:R ratios in fields like economics and engineering are somewhat less skewed, but at UVA, much as in other leading research universities, the less skewed are still extremely skewed. The only exceptions to overwhelming Democratic donations are those of the blue-collar and coaching staff.
| Department | Democratic | Republican | D:R Donor Ratio |
| American Studies | 2 | 0 | 2:0 |
| Anthropology | 15 | 1 | 15:1 |
| Architecture | 32 | 0 | 32:0 |
| Art | 17 | 0 | 17:0 |
| Biology | 26 | 0 | 26:0 |
| Business | 58 | 4 | 15:1 |
| Chemistry | 13 | 1 | 13:1 |
| Classics | 6 | 1 | 6:1 |
| Coaches of Sports Teams | 7 | 4 | 1.8:1 |
| Economics | 13 | 3 | 4:1 |
| Education | 73 | 1 | 73:1 |
| Engineering | 66 | 5 | 13:1 |
| English | 62 | 0 | 62:0 |
| Environmental Studies | 11 | 0 | 11:0 |
| Geography | 1 | 0 | 1:0 |
| Geology | 1 | 0 | 1:0 |
| Health Studies | 7 | 1 | 7:1 |
| History | 33 | 0 | 33:0 |
| Identity Studies (Africana Studies, etc.) | 12 | 0 | 12:0 |
| IT | 6 | 0 | 6:0 |
| Languages | 41 | 0 | 41:0 |
| Law | 66 | 6 | 11:1 |
| Librarians | 49 | 2 | 24:1 |
| Mathematics | 7 | 0 | 7:0 |
| Media Studies | 10 | 0 | 10:0 |
| Medicine | 126 | 6 | 21:0 |
| Music | 14 | 0 | 14:0 |
| Nursing | 14 | 1 | 14:1 |
| Philosophy | 10 | 0 | 10:0 |
| Phys Ed | 4 | 0 | 4:0 |
| Physics and Astronomy | 21 | 1 | 21:1 |
| Politics | 28 | 3 | 28:3 |
| Psychology | 19 | 1 | 19:1 |
| Public Policy | 25 | 1 | 25:1 |
| Religion | 20 | 0 | 20:0 |
| Sociology | 8 | 0 | 8:0 |
| Staff-Blue Collar | 11 | 8 | 1.4:1 |
| Staff-White Collar | 1298 | 74 | 17.5:1 |
| Theater | 6 | 0 | 6:0 |
| Dept. Affiliation Missing | 17 | 1 | 17:1 |
| 2255 | 125 | 18:1 |
Conclusion
The pattern of political donations at UVA roughly matches the patterns I have seen in other leading institutions. Previously, I have not looked at coaches and blue-collar staff, and these subgroups likely remain outside the highly politicized cultures of American university faculty and administrators in general and at the University of Virginia in particular. 21 of 39 departments that employ political donors during the three two-year 2017 to 2022 election cycles have Democratic but not Republican donors, and the remaining departments are mostly absurdly skewed Democratic.
Organizational cultures and organizational norms are difficult or impossible to change without major upheavals. In the private sector many corporations have preferred decline and bankruptcy to organizational culture change. There is no reason to believe that universities are an exception to this principle.
1 Mitchell Langbert and Sean Stevens, “Partisan Registration of Faculty in Flagship Colleges,” Studies in Higher Education 47, no. 8 (2022): 1750-60, https://doi.org/10.1080/03075079.2021.1957815.
2 Mitchell Langbert, “University Scientism and American Economic Interests,” Industry and Higher Education 32, no 3 (2018): 1-9, https://doi.org/10.1177/0950422218765664. See William F. Buckley’s classic description of left-wing culture at Yale in God and Man at Yale: The Superstitions of ‘Academic Freedom’ (1951). A contrast can be made with Upton Sinclair’s The Goose-step: A Study of American Education (1923). Writing at the cusp of a transformation that the Carnegie Foundation for the Advancement of Teaching had initiated in the early twentieth century, Sinclair complains of the conservatism of City College and Columbia University in New York, particularly of the conservatism of Columbia’s president, Nicholas Murray Butler. A conservative administrator like Butler would not have existed in post-1960s universities.
3 Mitchell Langbert, Anthony Quain, and Daniel Klein, “Faculty Voter Registration in Economics, History, Journalism, Law, and Psychology,” Econ Journal Watch 13, no. 3 (September 2016): 422-451, https://econjwatch.org/articles/faculty-voter-registration-in-economics-history-journalism-communications-law-and-psychology.
4 Mitchell Langbert, “Homogeneous: The Political Affiliations of Elite Liberal Arts College Faculty,” Academic Questions 32, no. 2 (April 2018):186-97, https://www.nas.org/academic-questions/31/2/homogenous_the_political_affiliations_of_elite_liberal_arts_college_faculty.
5 Sam Abrams, “Think Professors Are Liberal? Try School Administrators,” New York Times, October 16, 2018, https://www.nytimes.com/2018/10/16/opinion/liberal-college-administrators.html.
6Mitchell Langbert, “The Left Orientation of Industrial Relations,” Econ Journal Watch 13, no. 1 (January 2016): 46-74, https://econjwatch.org/articles/the-left-orientation-of-industrial-relations; Mitchell Langbert, “Republicans Need Not Apply: An Investigation of the American Economic Association Using Voter Registration and Partisan Contributions,” Econ Journal Watch 17, no. 2 (September 2020): 392-404, https://econjwatch.org/articles/republicans-need-not-apply-an-investigation-of-the-american-economic-association-using-voter-registration-and-political-contributions.
7 William F. Whyte, Street Corner Society (Chicago: University of Chicago Press, 1943); Philip Selznick, Leadership in Administration (Evanston, IL.: Row Peterson, 1957).
8 Mitchell Langbert, “Neil Gross’s Plantation Model of the Academic Labor Market,” Academic Questions 29, no. 1 (February 2016): 49-58, https://www.nas.org/academic-questions/29/1/neil_grosss_plantation_model_of_the_academic_labor_market; Neil Gross, Why Are Professors Liberal and Why Do Professors Care? (Cambridge: Harvard University Press, 2013).
9Alejandra O’Connell-Domenech, “Democrats More Likely to Than Republicans to Have Donated to Political Campaign in Past Two Years: Poll,” The Hill, July 23, 2023, https://thehill.com/homenews/campaign/4080356-democrats-more-likely-than-republicans-to-have-donated-to-a-political-campaign-in-past-two-years-poll/.
Photo by David Matthew Lyons on Adobe Stock

